


Trade lanes are more than routes between two countries. For freight forwarders, every lane represents a mix of shipment activity, revenue, cost, gross profit, customer demand, and commercial opportunity.
The challenge is that these factors do not always move in the same direction.
A route can carry a high shipment volume but generate weaker gross profit. Another lane may handle fewer shipments yet contribute more financial value. If teams look only at volume or revenue, they can easily miss what is actually happening.
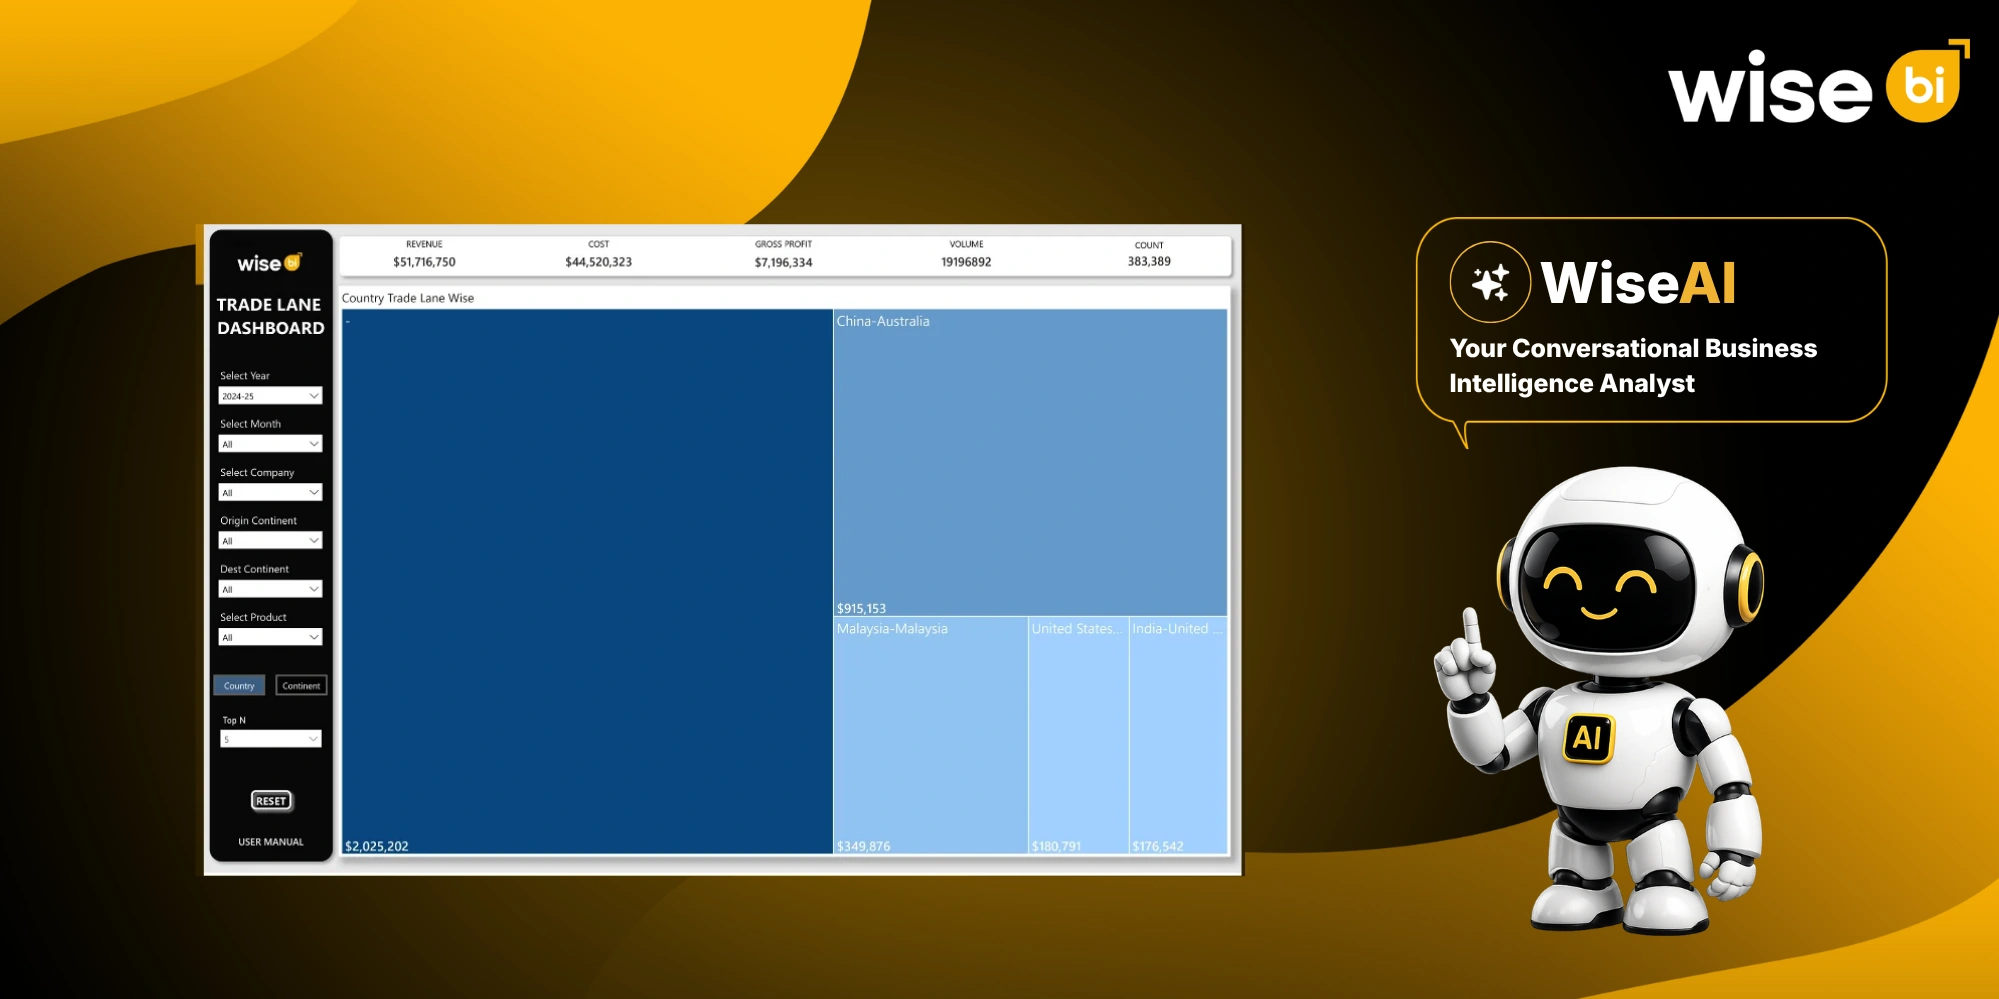
WiseBI’s CargoWise Trade Lane Dashboard brings operational and financial metrics together, including revenue, cost, gross profit, volume, and count, while allowing users to analyze routes by country, continent, company, product, month, year, and top N performance.
The real value is not simply having another dashboard. It is knowing which trade lanes are adding value, which are changing, and where your team should focus next.
Get a Clearer View of Trade Lane Profitability
Revenue is valuable, but it does not tell the entire story.
A high-revenue lane may also incur high costs. Without considering gross profit, management may believe a route is commercially strong when its financial contribution is actually lower.
The CargoWise Trade Lane Dashboard allows freight forwarders to compare:
- Revenue
- Cost
- Gross Profit
- Volume
- Count
in one view.
This enables finance, commercial, and operations teams to assess trade lane profitability more clearly.
Rather than asking, “Which route generates the most revenue?”,” Teams can ask:
“Which route provides the strongest return after costs?”
That gives teams a stronger basis for commercial planning.
Understand Whether More Volume is Creating More Value
Shipment volume is often treated as a sign of growth.
But more freight does not automatically mean better performance.
A lane may show increasing volume and count while gross profit stays flat. In that situation, the business may be processing more shipments without seeing the same improvement in financial contribution.
By reviewing operational and financial KPIs together, freight forwarders can distinguish between:
- High-volume, high-profit lanes
- High-volume routes with weaker returns
- Lower-volume lanes with stronger financial contribution
- Routes where workload is increasing faster than profitability
This helps management separate higher activity from stronger business performance.
Compare Origin-to-Destination Trade Lane Performance
Looking at origins and destinations separately can hide the true performance of a route.
A country may be a major origin, while another may be a major destination. But that does not tell you how the complete origin-to-destination corridor performs.
The CargoWise Trade Lane Dashboard’s country trade lane-wise view lets users compare complete country-to-country lanes.
This helps freight forwarders see:
- Which country pairs generate the strongest contribution
- Where shipment activity is concentrated
- Which routes have high volume but weaker financial performance
- Which origin-destination combinations deserve closer review
That makes trade lane analysis more useful than reviewing top origins or destinations independently.
See the Bigger Picture with Continent-Level Analysis
For freight forwarders operating across multiple regions, country-level analysis can become crowded quickly.
The CargoWise Trade Lane Dashboard allows users to switch between country and continent views and filter by origin continent and destination continent.
This creates a clear analysis path:
Network → Continent → Country → Trade Lane
Management can first identify broader regional patterns and then drill down into the specific country pairs behind them.
That is especially useful for leadership teams that need both a high-level network view and route-level detail.
Analyze Trade Lane Performance by Product
Not every freight product performs the same way across every route.
A trade lane may look strong overall but be driven mainly by one product. Another product on the same corridor may contribute much less.
The CargoWise Trade Lane Dashboard includes a product filter, allowing users to isolate route performance by product.
This helps commercial teams understand:
- Which products contribute most to certain routes
- Whether growth is concentrated in one service
- Where product performance differs by trade lane
- Which route-product combinations may deserve more attention
That gives freight forwarders a clearer basis for product and market discussions.
Compare Trade Lane Performance Across Companies
For logistics groups operating multiple business entities, consolidated results can hide important differences.
The BI dashboard includes a company filter, allowing users to compare trade lane performance by entity.
This makes it easier to see whether a strong route is performing consistently across the organization or whether most of the contribution comes from one company.
That visibility helps management see where trade lane performance is strongest across the business.
Track How Trade Lanes Change Over Time
A strong route today may not remain strong forever.
Customer demand changes, costs shift, shipment activity rises or falls, and product mix evolves.
The CargoWise Trade Lane Dashboard includes year and month filters, allowing freight forwarders to compare trade lane performance across multiple reporting periods.
This can help identify:
- Routes gaining or losing volume
- Revenue changes
- Cost movements
- Gross Profit improvement or decline
- Trade lanes showing sustained performance changes
Looking at trends over time gives management more context than reacting to a single month.
Focus Attention with Top N Analysis
Large freight networks may contain dozens or even hundreds of trade lanes.
Reviewing every route at once can make it difficult to identify what matters most.
The BI dashboard’s Top N filter helps users focus on the highest-ranking trade lanes in the selected view.
This is useful during management reviews because teams can quickly identify the routes making the largest contribution and then investigate them in more detail.
Top N analysis does not replace deeper review, but it gives teams a practical starting point.
Make Trade Lane Reviews More Focused
One of the biggest benefits of a CargoWise Trade Lane Dashboard is that it gives different teams a shared view of lane performance.
Operations can understand shipment activity. Finance can compare revenue, cost, and gross profit. Commercial teams can review route contribution and product performance, while management can move between company, country, continent, and time-based analysis.
Instead of each team working from separate reports, the dashboard creates a more connected view of trade lane performance.
WiseBI also enhances this experience with Conversational BI, allowing users to ask natural-language questions about trade lane performance and use follow-up questions to refine the analysis.
This helps teams move more quickly from a broad performance view to the specific route, product, company, or period that needs attention, while giving operations, finance, commercial, and management teams a shared basis for review.
Conclusion
Trade lane performance becomes more useful when freight forwarders can see the financial and operational story behind each route.
WiseBI’s CargoWise Trade Lane Dashboard brings revenue, cost, gross profit, volume, count, geography, product, company, and time-based performance into one connected view. This helps teams understand which lanes are contributing value, which routes need closer attention, and where commercial opportunities may be developing.
Instead of relying on separate reports or judging routes only by volume, freight forwarders can review trade lane performance with clearer context and make more informed decisions.
Want to see which trade lanes are driving the strongest results across your network? Schedule a free demo with WiseBI and explore your CargoWise trade lane data in a clearer, more actionable way.