If you’re in the logistics business, keeping a close eye on your Less-than-Container Load (LCL) shipments is crucial to staying ahead of trends and maximizing efficiency. But how do you ensure that you’re not just keeping track of these shipments, but actually optimizing them for better business results?
The answer lies in real-time data insights. Whether you’re monitoring volume, shipping trends, or country-specific data, knowing how and when shipments are moving helps you make smarter decisions and better plan for future shipments.
Let’s further into the power of Ocean LCL Volume vs. LCL Shipments Insights, a dashboard that helps you track, analyze, and optimize your LCL shipments. By looking at monthly trends and analyzing shipment volume by country of origin, you’ll have the data needed to improve your operations.
Understanding the Importance of LCL Shipments
Less-than-Container Load (LCL) shipments allow businesses to ship smaller volumes of goods without the need to fill an entire container. This is particularly useful for businesses that don’t have enough freight to justify the cost of a full container, but still need to ship goods internationally.
However, while LCL shipments offer cost-effective options for many businesses, they also come with the challenge of optimizing shipment volumes and managing fluctuations in demand. Without proper tracking and analysis, companies might face inefficiencies, missed opportunities, or higher costs.
The Ocean LCL Volume vs. LCL Shipments Dashboard is designed to help businesses better understand and optimize their LCL shipments by giving you detailed insights into shipping trends, volumes, and performance by country of origin.
How the LCL Volume vs. LCL Shipments Dashboard Works
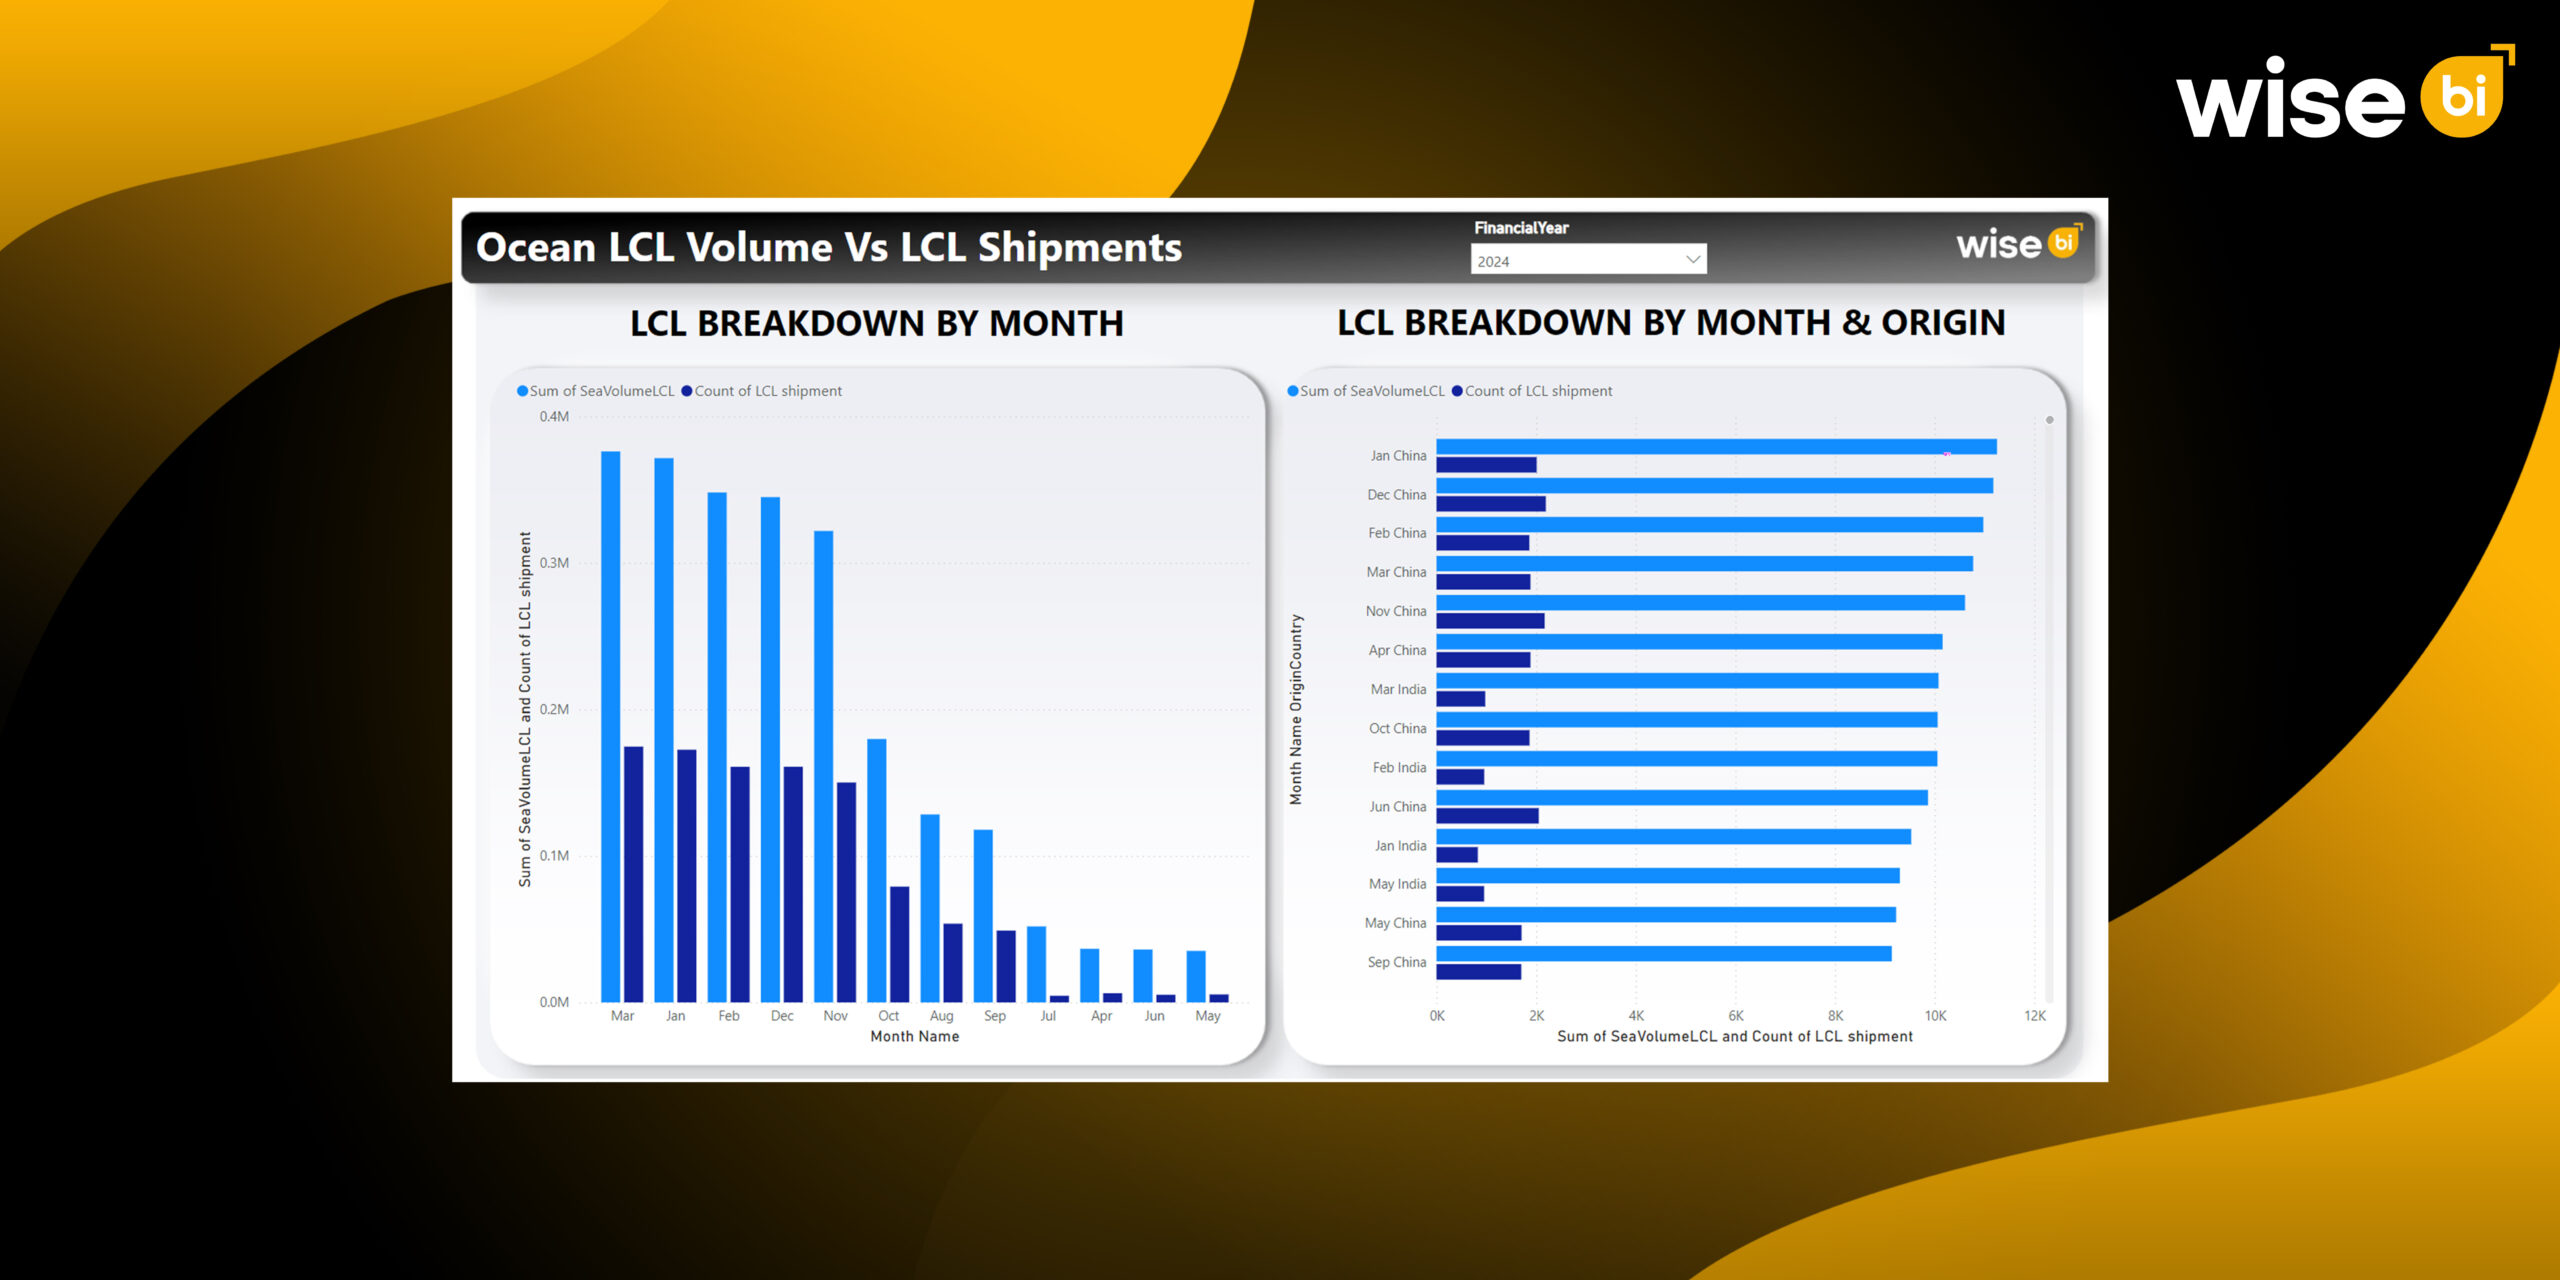
1. LCL Breakdown by Month
This graph shows the monthly shipment volume and count of LCL shipments over the course of the year. It allows you to track fluctuations in volume, which can be impacted by seasonal trends, market demand, or changes in customer behavior.
What the dashboard provides: You get a clear view of the monthly volume of LCL shipments, represented by bars that show the total volume and shipment count each month.
What you’ll learn: Tracking volume by month lets you see patterns in shipping demand. Are there certain months where shipments are higher than others? Is there a drop-off in certain seasons that could affect inventory or planning?
Why it matters: By identifying trends, you can anticipate periods of high demand and adjust resources, routes, or pricing strategies accordingly.
For example, if you notice higher LCL volumes in January through March, but a steep drop in the summer months, you can start planning for those fluctuations, adjusting staffing levels or adjusting your marketing efforts to account for the slowdown.
2. LCL Breakdown by Month & Origin
This part of the dashboard goes a step further by showing you how LCL shipments are distributed by country of origin for each month. It provides a detailed look at which regions are driving the most shipments, allowing you to pinpoint which countries or regions are seeing the highest shipment volumes.
What the dashboard provides: It shows shipment volume by country, highlighting the number of LCL shipments coming from specific regions like China, India, the US, and more.
What you’ll learn: This breakdown allows you to see which countries are consistently sending high volumes and which may be experiencing a drop in shipments. You’ll gain a better understanding of your top-performing regions and identify any areas that may need more attention.
Why it matters: This is key for route optimization, inventory planning, and resource allocation. For instance, if China is consistently the highest contributor to LCL shipments, you may want to prioritize partnerships or routes that specifically accommodate this high demand.
Understanding your country-specific shipping trends also helps with negotiating better rates, improving vendor relationships, or managing customs and regulatory requirements more effectively.
Why You Should Care About These Insights
With this real-time data at your fingertips, you’re no longer making decisions based on guesswork or past performance. Instead, you’re using actionable insights to optimize your operations and make more informed decisions. Here’s why this matters:
1. Forecasting and Planning
The ability to track monthly trends in LCL shipments allows you to forecast future demand. You’ll know when to ramp up shipments or prepare for quieter months, making it easier to balance supply and demand, adjust inventory, and avoid shipping delays. By understanding the peaks and valleys of shipping volume, you can better align your resources, labor, and production schedules to avoid bottlenecks.
2. Cost Optimization
Shipping costs can be one of the largest expenses for a logistics company, and LCL shipments are no exception. By analyzing trends in shipping volumes and counts, you can better understand which regions and routes offer the best value and which may be driving up costs unnecessarily. You’ll gain insights into which routes and origins are more efficient and which ones need closer scrutiny for cost optimization.
3. Customer Satisfaction
Monitoring LCL shipments based on country of origin helps ensure that your shipping processes are aligned with customer needs. If you notice that demand is high in certain regions, you can prioritize those regions to meet customer expectations more quickly and avoid delays. Adjusting to these insights can help improve on-time delivery and customer satisfaction, which is key for retaining clients and boosting repeat business.
4. Supply Chain Efficiency
Shipping performance directly impacts your supply chain. With the LCL dashboard’s insights, you can analyze which regions are the most reliable, which countries are experiencing obstacles, and where you might need to implement better systems for quicker processing. By optimizing the flow of goods from specific countries, you can eliminate unnecessary delays, streamline operations, and ultimately reduce costs.
Conclusion
With real-time data on LCL shipments by month and country of origin, you can stay ahead of trends, optimize shipping routes, and improve your supply chain management—all while ensuring your shipping processes are cost-effective and efficient.
The Ocean LCL Volume vs. LCL Shipments Insights dashboard empowers you to make informed, data-driven decisions that will improve your operations, save money, and help you deliver a better experience to your customers.
Are you ready to optimize your LCL shipments and gain actionable insights? Get in touch today to see how this shipment analysis dashboard can enhance your shipping performance and drive business growth.