For global freight forwarders, visibility is one of the most important drivers of business success.
Every day, CargoWise collects massive amounts of operational and financial data; however, having access to data does not imply visibility. When data is spread across multiple reports and business units, it becomes more difficult to identify trends, measure profitability, and track performance.
The solution lies in Wise BI’s CargoWise Global Insights Dashboard. It converts fragmented data into actionable business intelligence, providing decision-makers with real-time visibility into revenue, gross profit, transportation performance, product contribution, and operational activity across the organization.
This enables logistics leaders to shift their focus from reporting to strategic decision-making.
Why does Global Operations Visibility Matter in Modern Freight Forwarding?
As freight forwarding companies grow, operational complexity rises significantly.
Organizations often manage:
- Multiple companies
- Global branches
- Freight forwarding operations
- Warehousing services
- Customs brokerage
- Transportation management
- Cross-trade shipments
- Third-party logistics services
Every business function creates its own performance metrics. Without centralized visibility, decision-makers are frequently forced to analyze multiple CargoWise reports before understanding what is happening across the business.
This creates critical business questions:
- Which services generate the highest revenue?
- Which products deliver the strongest margins?
- Which branches outperform others?
- Which transport modes are driving growth?
- Where is operational workload concentrated?
- Are profit margins improving or declining?
- Which areas need immediate management attention?
Finding these answers manually can delay decision-making and reduce business agility.
The CargoWise BI dashboard solves the manual reporting problems by providing a unified, real-time view of global operations and financial performance.
What can You Find on a CargoWise Global Insights Dashboard?
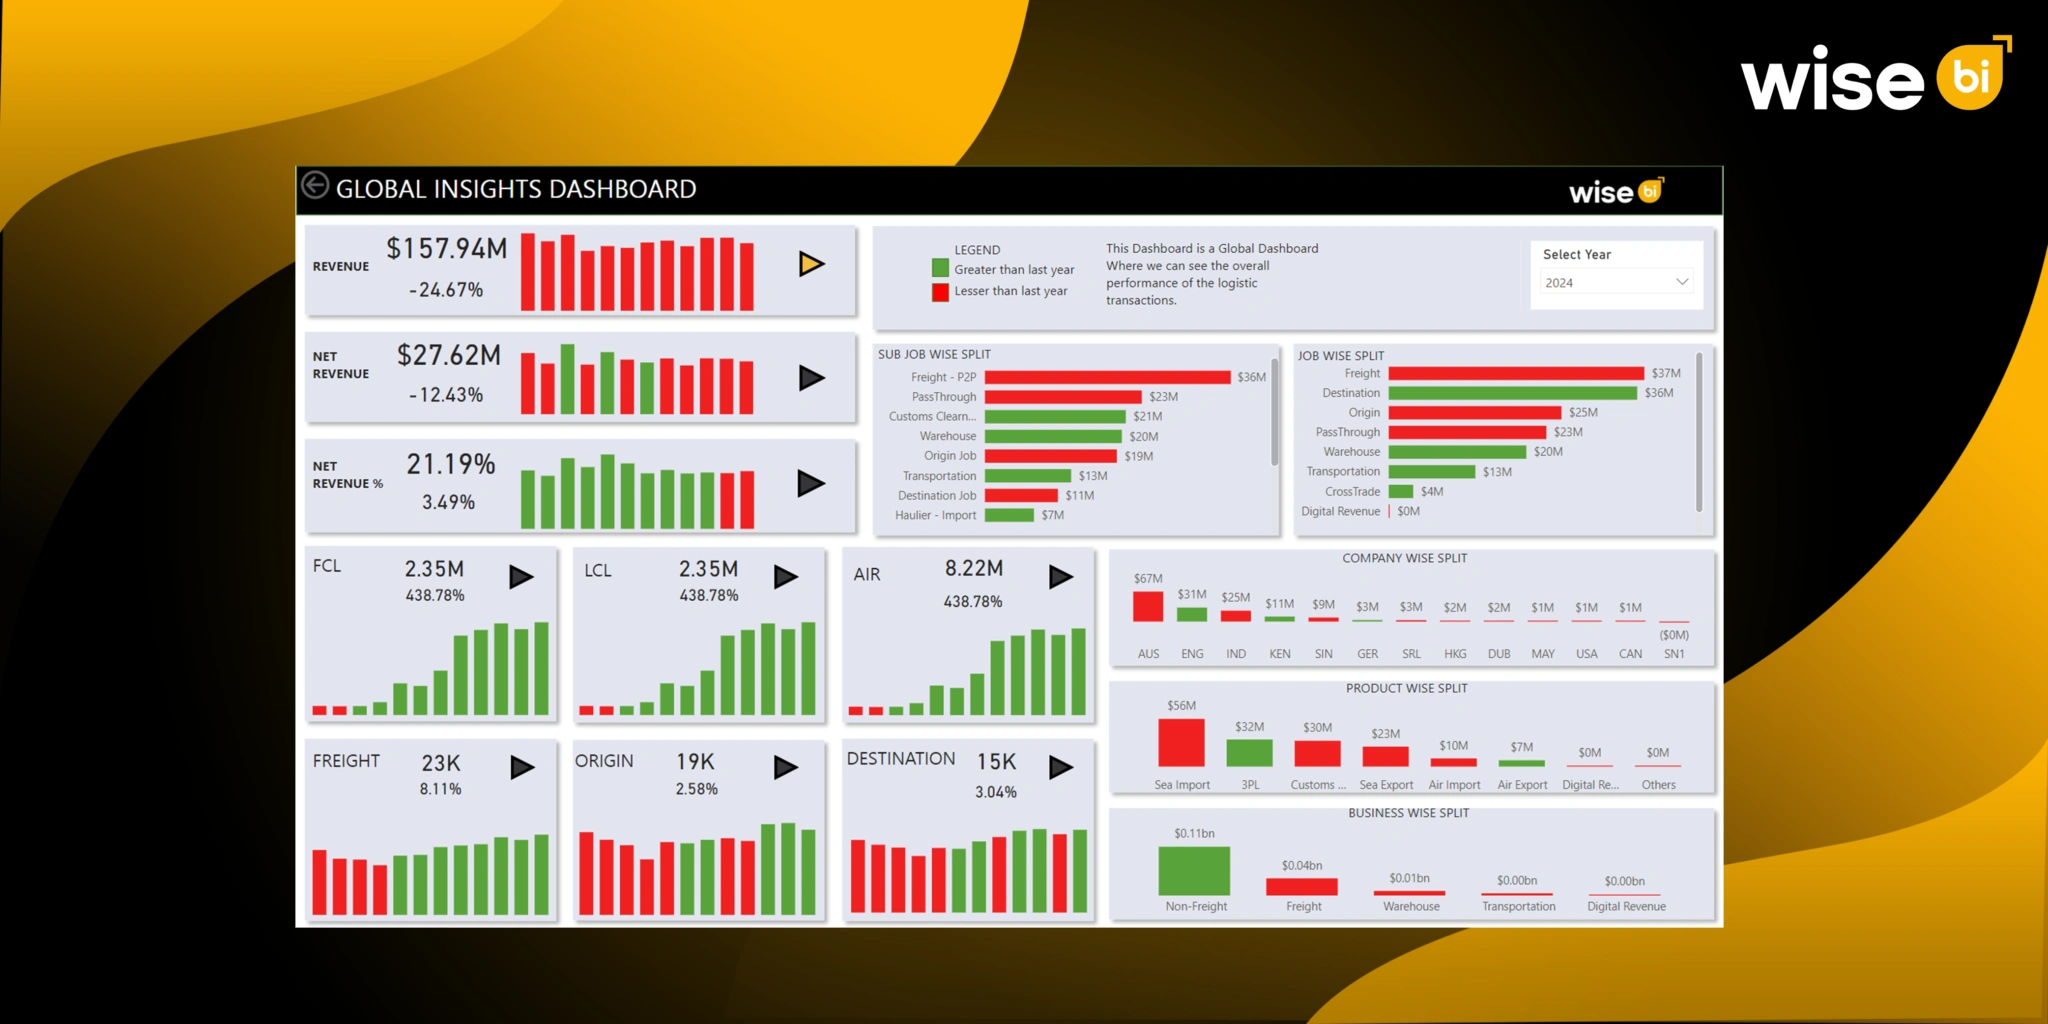
Wise BI’s CargoWise global insights dashboard presents a comprehensive overview of key freight forwarding performance indicators, allowing leadership teams to track business performance from a single screen.
Revenue and Gross Profit Performance
At the executive level, revenue alone is not enough.
A business may experience shipment growth while profitability remains under pressure due to rising costs or shrinking margins.
The BI dashboard provides instant visibility into:
- Revenue
- Gross Profit
- Gross Profit Percentage
These key performance indicators help management understand both growth and profitability.
With monthly trend analysis, leadership teams can quickly identify:
- Revenue growth patterns
- Margin fluctuations
- Seasonal business trends
- Emerging profitability risks
- Long-term performance improvements
This enables more proactive financial management and better strategic planning.
Operational Performance Visibility
Freight forwarding operations involve multiple service lines operating simultaneously.
Understanding where operational effort is being spent is essential for improving efficiency and resource allocation.
The BI dashboard provides visibility through:
Job-Wise Analysis
Track activity across:
- Freight Operations
- Origin Services
- Destination Services
- Transportation
- Warehouse Operations
- Cross Trade
- Pass Through Services
- Other Operational Activities
Sub-Job Analysis
Gain deeper insight into:
- Freight P2P Activities
- Customs Clearance
- Warehousing Services
- Transportation Operations
- Haulier Services
- Destination Handling
Business Segment Analysis
Compare performance across:
- Freight Forwarding
- Warehousing
- Non-Freight Services
- Value-Added Logistics Services
This visibility helps identify operational problems, workload distribution, and areas requiring additional resources.
Transport Mode Performance Analysis
Market conditions, customer requirements, and global supply chain disruptions can all cause rapid shifts in transportation demand.
The BI dashboard provides transport-wise visibility across:
- Sea Freight
- Air Freight
- Road Freight
- Rail Freight
- Courier Services
- Mail Services
- Other Transport Categories
This allows management teams to understand:
- Which transport modes are growing fastest
- Where demand is strongest
- Which services contribute most to revenue
- How market conditions impact operational performance
Businesses with improved transportation visibility can better allocate resources and respond to changing market conditions.
Product Performance Visibility
Not all logistics products make equal contributions to business success.
The BI dashboard assists freight forwarders in evaluating performance across products, including:
- Sea Import
- Sea Export
- Air Import
- Air Export
- Customs Clearance
- 3PL Services
- Warehouse Services
- Other Logistics Solutions
Understanding product-level performance enables organizations to:
- Identify high-performing services
- Improve product profitability
- Support pricing decisions
- Focus sales efforts on growth opportunities
- Optimize service portfolios
This changes product analysis from reactive reporting to strategic business planning.
Company and Branch Performance Comparison
For organizations with multiple locations, branch-level visibility is critical.
The BI dashboard enables leadership teams to compare:
- Company Performance
- Branch Performance
- Product Performance
- Transport Activity
- Financial Results
Using dynamic filters, users can instantly analyze data by:
- Company
- Branch
- Product
- Transport Mode
- Financial Year
- Reporting Period
Instead of reviewing multiple CargoWise reports, executives can compare business performance using a single, centralized platform.
Monthly Trends and Growth Analysis
Business performance should not be measured using a single point in time.
The Global Insights Dashboard provides monthly trend analysis for:
- Revenue
- Gross Profit
- Gross Profit Percentage
This allows leadership teams to identify:
- Seasonal fluctuations
- Revenue acceleration
- Margin deterioration
- Business growth opportunities
- Emerging operational challenges
Early visibility enables organizations to take corrective action before problems affect overall profitability.
How can the BI Dashboard Help Freight Forwarders Make Faster Decisions?
The true value of a CargoWise Global Insights dashboard is not just reporting.
It is about making data-driven decisions at the right time.
Connecting operational and financial insights allows leadership teams to:
- Compare branch and company performance
- Monitor transport contribution
- Identify profitable business segments
- Track product-level growth
- Detect margin erosion early
- Understand operational workload distribution
- Improve executive reporting
- Support strategic planning
- Drive data-driven decision-making
Instead of reacting to historical reports, businesses can act on current performance insights.
Why are BI Dashboards More Valuable than Traditional CargoWise Reports?
CargoWise provides powerful operational reporting capabilities.
However, many organizations still spend significant time consolidating information from multiple reports before gaining meaningful business insights.
Traditional reporting often requires users to:
- Export multiple reports
- Compare spreadsheets manually
- Consolidate financial and operational data
- Create management summaries
A business intelligence dashboard eliminates these barriers.
I know what you’re thinking: Why not build a BI solution in-house?
Many logistics companies face this decision before investing in an internal BI team and custom dashboard development. If you’re evaluating both options or planning to implement a BI solution, explore our blog comparing in-house BI teams with ready-to-use dashboards.
By converting CargoWise data into visual, interactive insights, organizations benefit from:
- Faster analysis
- Improved visibility
- Better executive reporting
- Real-time performance monitoring
- Reduced manual reporting effort
- Stronger strategic decision-making
Rather than managing data, leaders can focus on improving business outcomes.
Real Business Impact of a CargoWise Global Insights Dashboard
Organizations that implement BI solutions often achieve measurable improvements in visibility and decision-making.
Benefits commonly include:
- Faster management reporting
- Improved profitability tracking
- Greater operational transparency
- Enhanced branch accountability
- Better resource planning
- Increased executive confidence
- More informed strategic decisions
For freight forwarders operating in highly competitive markets, these advantages can create a significant performance edge.
Conclusion
Business intelligence is no longer a luxury. For freight forwarders, it has become an essential tool for improving visibility, profitability, and decision-making.
A CargoWise Global Insights Dashboard provides a complete view of business performance through a single, centralized platform. By bringing together revenue, gross profit, operational activity, transport performance, product contribution, branch visibility, and business trends, organizations gain the clarity needed to make faster and more informed decisions.
Instead of spending valuable time consolidating reports, leadership teams can focus on identifying opportunities, addressing performance gaps, and driving business growth.Want clearer visibility across your global logistics operations? Book a free demo and discover how a CargoWise Global Insights Dashboard can help you improve performance, profitability, and decision-making across your organization.