Your warehouse may have the data, but can your team see what needs attention right now?
Warehouse operations now involve high order volumes, multiple locations, complex customer requirements, picking, receiving, inventory adjustments, and tight delivery timelines.
CargoWise manages these activities and captures valuable operational data. The real challenge is turning that data into clear, timely insights that warehouse managers can use to make faster decisions.
Each order entered, pick completed, receipt processed, inventory adjustment recorded, and shipment dispatched generates useful operational data. The challenge is not gathering this information. The challenge is to convert it into clear insights that warehouse managers can apply quickly.
Importance of Real-Time CargoWise Warehouse Visibility
Warehouse operations move quickly. A small delay in one process can affect several other activities.
A backlog in receiving may delay inventory availability. Picking delays can slow order dispatch. A rise in orders waiting for action can affect customer service. One overloaded warehouse can struggle while another location has available capacity.
When warehouse managers rely only on daily, weekly, or monthly reports, these issues may be discovered after performance has already declined.
Real-time warehouse insights dashboards give CargoWise users one clear view of warehouse performance, replacing separate reports and manual spreadsheets.
This helps logistics businesses move from reactive reporting to proactive warehouse management.
Recurring Warehouse Analytics Challenges for CargoWise Users
CargoWise contains detailed warehouse information, but many logistics companies still struggle to understand operational performance.
Warehouse Data is Spread Across Multiple Reports
Warehouse managers may use separate reports for orders, picking, receiving, inventory adjustments, customers, and warehouse locations.
Each report may contain useful information, but reviewing them individually makes it difficult to understand the overall operational picture. The real-time BI dashboard solves the CargoWise reporting challenges and provides a unified view.
Order Performance is Difficult to Monitor
Warehouse managers need immediate answers to questions such as:
- How many orders are currently being processed?
- Which orders are delayed?
- Which warehouse has the highest backlog?
- Which customers are being affected?
- At what stage are orders becoming delayed?
Without a centralized view, teams may need to export multiple reports and manually compare the information.
Picking and Receiving Blockages Remain Hidden
Picking and receiving directly affect warehouse throughput.
If receiving activities slow down, inventory may not become available for order fulfillment. If the picking activity falls behind, completed orders may not be ready for dispatch.
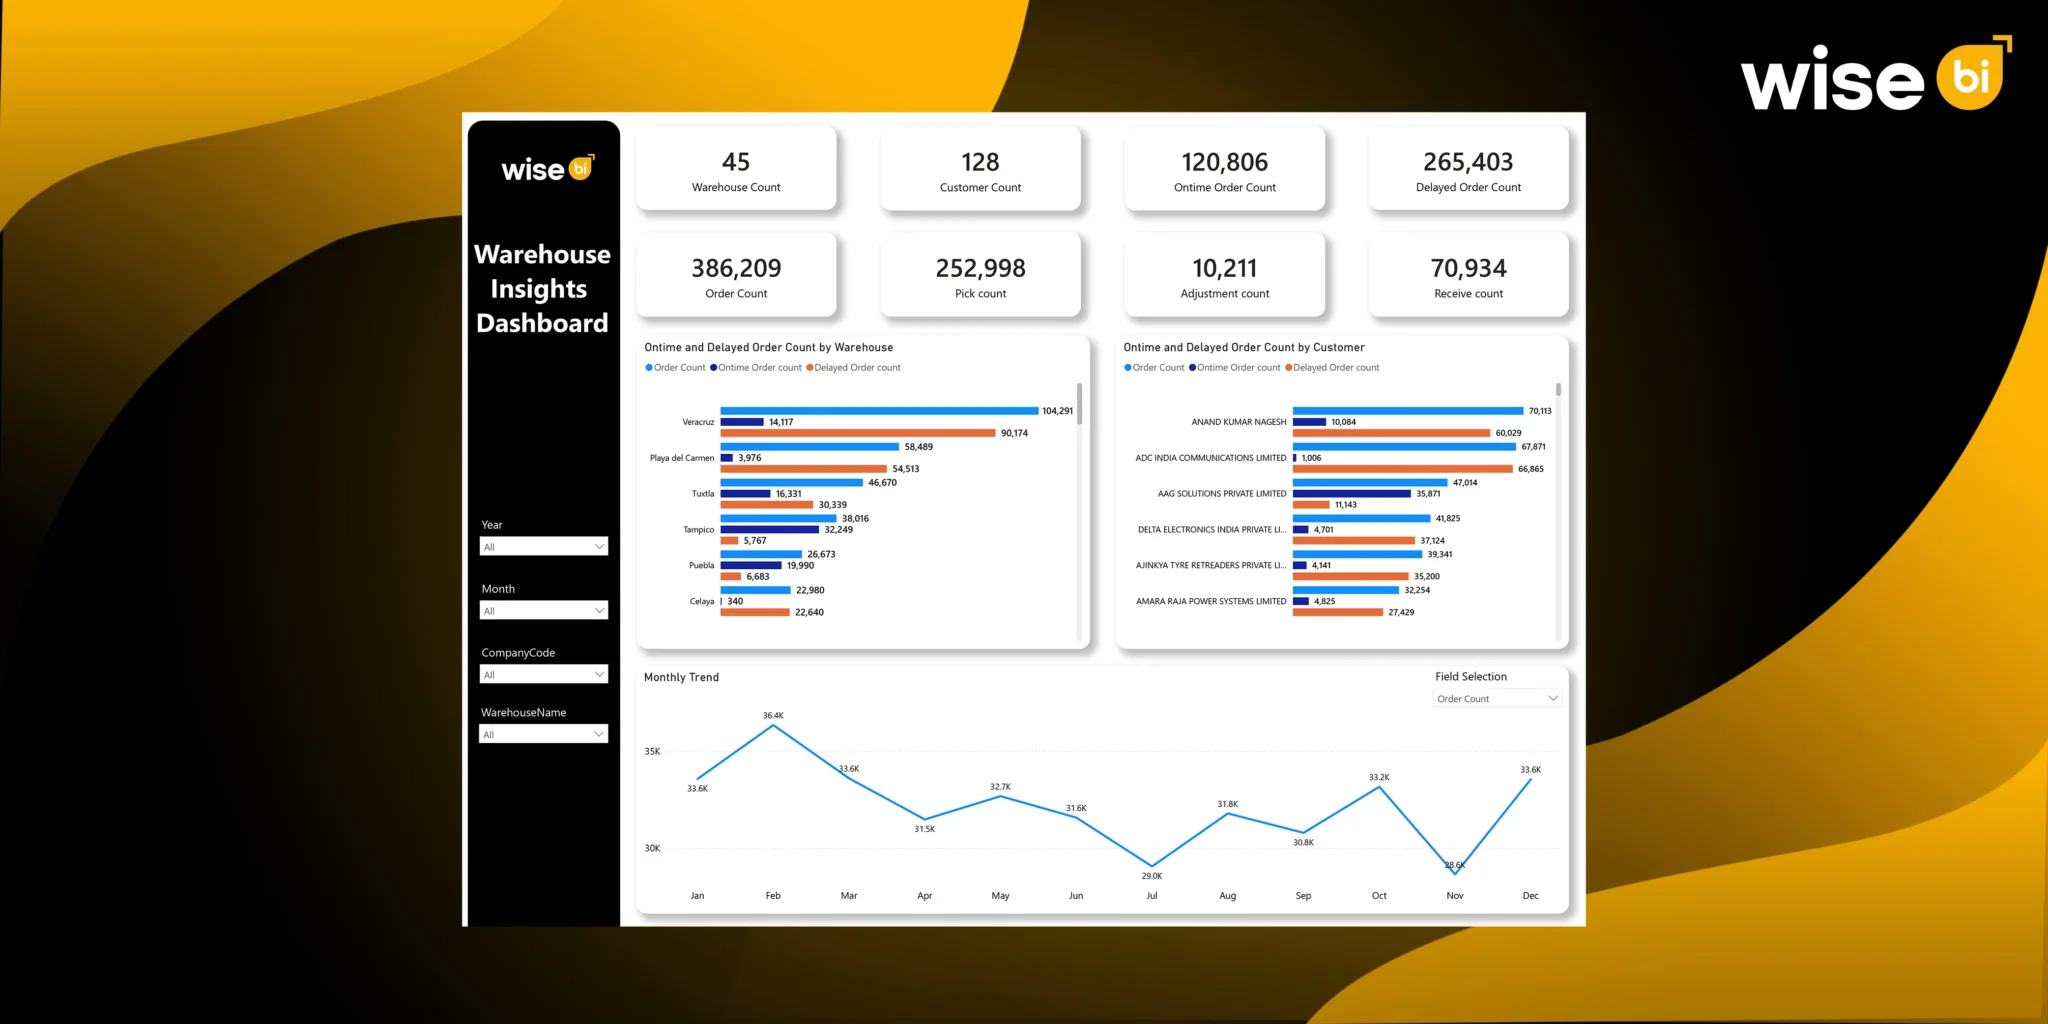
The WiseBI CargoWise Warehouse Insights Dashboard provides visibility into order, pick, receive, and adjustment activity. It also separates warehouse transactions by their operational status, helping managers see where work is completed and where activity is still waiting for action.
This makes it easier to identify bottlenecks before they affect the entire warehouse process.
Multi-Warehouse Performance is Difficult to Compare
Logistics companies operating multiple warehouse locations need consistent visibility across every site.
One warehouse may process more orders but experience a higher level of delays. Another location may handle a smaller workload but maintain stronger fulfillment performance.
A real-time warehouse dashboard helps management to compare warehouse activity, workload, and order performance using the same reporting structure.
How do Real-Time Warehouse Dashboards Help CargoWise Users?
A warehouse dashboard transforms CargoWise data into practical operational insights.
Instead of opening multiple reports, managers can monitor the health of warehouse operations on a single screen.
Monitor Order Performance from One Dashboard
A real-time warehouse outbound dashboard can provide visibility into:
- Total warehouse orders
- On-time and delayed orders
- Order processing status
- Warehouse-level order performance
- Customer-level order performance
- Monthly order trends
Order status visibility is especially important because it helps managers understand where orders are within the warehouse process.
This allows supervisors to focus on orders that require immediate attention rather than reviewing every transaction individually.
Improve Picking Performance
Warehouse picking is a critical part of warehouse fulfillment.
The warehouse picking dashboard provides visibility into total picking activity and the status of pick operations. Managers can identify picks that have been created, printed, completed, or are still waiting for further action.
A growing number of incomplete picks may indicate:
- Labor shortages
- Stock-location issues
- Order complexity
- Equipment constraints
- Workload imbalances
- Process delays
Early visibility allows supervisors to investigate the cause and reallocate resources before dispatch performance is affected.
Track Receiving Activity More Effectively
Receiving performance influences inventory availability and downstream warehouse activity.
A real-time warehouse inbound dashboard allows teams to monitor receiving transactions at different operational stages, including activities that are entered, being put away, completed, canceled, or affected by errors.
This helps warehouse managers identify whether inbound stock is moving efficiently through the receiving process.
If receipts remain incomplete for too long, the team can investigate possible issues involving documentation, unloading, inspection, staffing, or put-away capacity.
Monitor Inventory Adjustments
Inventory adjustments provide important insight into warehouse accuracy.
A consistent increase in adjustments may indicate:
- Receiving discrepancies
- Picking errors
- Damaged stock
- Incorrect storage locations
- Data-entry issues
- Cycle-count differences
The warehouse dashboard includes adjustment activity and adjustment status, allowing management to monitor warehouse corrections alongside order, receiving, and picking activity.
This does not replace a detailed inventory investigation, but it helps managers identify unusual patterns earlier.
Compare Warehouse Performance
Warehouse dashboards help management compare activity across locations.
This supports decisions such as:
- Balancing workloads between warehouses
- Reviewing staffing requirements
- Identifying capacity constraints
- Comparing fulfillment performance
- Investigating underperforming sites
- Applying successful processes across locations
Warehouse performance should not be measured by order volume alone.
Managers must also consider delayed orders, picking progress, receiving activity, incomplete transactions, and operational errors.
A centralized dashboard makes these comparisons easier and more consistent.
Understand Customer Workload and Service Performance
Different customers create different levels of warehouse activity.
Some customers may generate high order volumes. Others may require more picking effort, frequent adjustments, special handling, or strict fulfillment timelines.
Customer-level warehouse reporting helps logistics businesses understand:
- Which customers generate the most warehouse activity
- Which customers experience more delayed orders
- Where additional operational resources may be required
- Whether service-level expectations are being achieved
- How customer demand affects warehouse workload
This information can support operational planning, customer communication, pricing reviews, and account management.
Important Warehouse KPIs CargoWise Users Should Monitor
A helpful warehouse dashboard should monitor the KPIs that directly affect fulfillment, productivity, and customer service.
Important warehouse KPIs include:
- Total order count
- On-time order count
- Delayed order count
- Order fulfillment rate
- Orders by processing status
- Pick count
- Pick status
- Receive count
- Receiving status
- Inventory adjustment count
- Adjustment status
- Orders by warehouse
- Delayed orders by warehouse
- Orders by customer
- Delayed orders by the customer
- Monthly order trends
- Orders held or canceled
- Jobs or transactions in error
WiseBI’s warehouse dashboard also supports filtering by warehouse, company, month, and year. This enables users to move from an overall business view to a specific location or reporting period that requires attention.
Operational Benefits of Real-Time Warehouse Dashboards
Real-time warehouse dashboards provide more than better-looking reports.
They help logistics companies:
- Make faster operational decisions
- Reduce manual reporting work
- Identify bottlenecks earlier
- Improve labor and workload planning
- Monitor customer service performance
- Compare multiple warehouse locations
- Improve picking and receiving visibility
- Detect unusual inventory activity
- Support more accurate management reporting
The greatest value comes from connecting warehouse processes rather than reviewing them separately.
WiseBI Delivers BI Dashboards for Transforming CargoWise Warehouse Data into Actionable Insights
CargoWise provides the operational system required to manage warehouse transactions.
WiseBI transforms this CargoWise warehouse data into interactive business intelligence for warehouse managers, operations teams, and business leaders.
The WiseBI Warehouse Insights Dashboard brings together:
- Order performance
- On-time and delayed fulfillment
- Picking activity
- Receiving activity
- Inventory adjustments
- Warehouse comparisons
- Customer activity
- Monthly operational trends
Users can filter and analyze warehouse performance without repeatedly exporting data into spreadsheets.
WiseBI also offers custom BI development and role-based reporting, allowing warehouse supervisors, operations managers, and executives to access information specific to their roles.
This helps teams move from fragmented warehouse reporting to a more consistent and proactive management process.
You can ask questions in plain language to our WiseAI, a conversational AI business analyst, and get instant warehouse insights without having to create reports.
Instead of using multiple filters, teams can ask business questions in natural language and receive clear answers via charts, tables, and visual insights.
WiseAI helps you:
- Ask questions in plain language
- Continue your analysis with follow-up questions
- Generate relevant charts and data tables
- Explore CargoWise data without technical reporting skills
- Access insights in multiple languages
- Maintain secure, read-only access based on user permissions
This makes warehouse insights easier to access for operations managers, warehouse teams, and business leaders.
Conclusion
Turn your CargoWise warehouse data into a competitive advantage.
Your CargoWise Warehouse Management System already captures the operational data your business needs. The real advantage comes from turning that data into clear, real-time insights that help your team act faster.
Ready to unlock the full potential of your CargoWise warehouse data? Schedule a free demo with WiseBI and discover how real-time warehouse dashboards can help your team make faster, smarter, and more confident decisions.