


Customs operations generate valuable data across jobs, customers, branches, transport modes, products, revenue, costs, and profit. For freight forwarders using CargoWise, the challenge is turning that data into a clear performance view.
A CargoWise Customs Analysis Dashboard brings operational and financial insights together, helping teams understand customs profitability, workload, customer contribution, branch performance, and job-level results.
Instead of asking only, “How many customs jobs did we process?” management can ask:
“Which parts of our customs operation are performing well, and where do we need to look closer?”
CargoWise Customs Analysis Dashboard
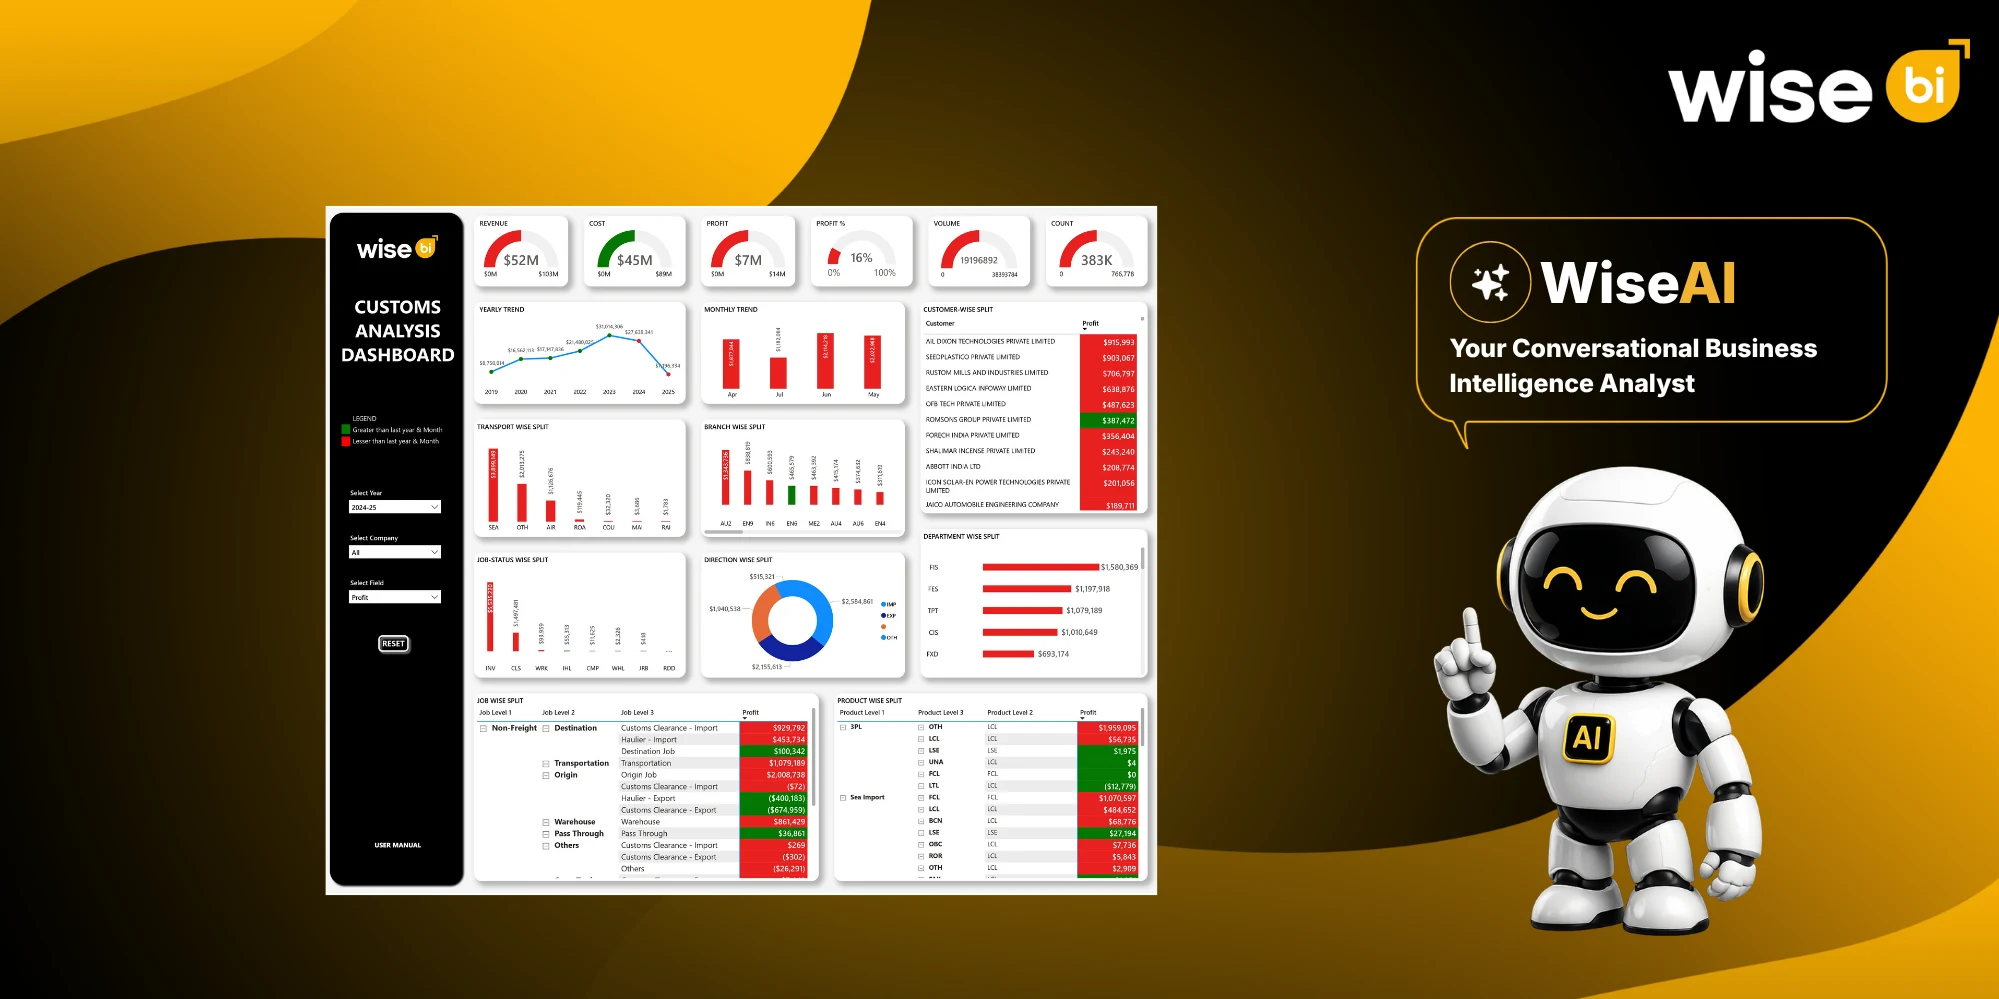
A CargoWise Customs Analysis Dashboard is a business intelligence reporting solution for analyzing customs-related operational and financial data in CargoWise.
It gives freight forwarders a clearer picture of customs performance than transaction-level reporting.
The BI dashboard includes six key performance indicators (KPIs):
- Revenue
- Cost
- Profit
- Profit %
- Volume
- Count
It then breaks performance down by customer, branch, department, transport mode, direction, job status, product, and job hierarchy. Users can also review monthly and yearly trends and drill down into individual CargoWise jobs.
This provides freight forwarders with a more comprehensive CargoWise customs analysis, including operational activity and financial performance.
Why is CargoWise Customs Performance Visibility Important for Freight Forwarders?
Customs activity is closely connected to the wider freight forwarding operation.
A single customer may require ocean freight, air freight, road transport, customs clearance, and additional services. This means that customs performance cannot be assessed in isolation.
If customs teams only consider job counts, they may overlook whether the activity is commercially viable. If finance teams only focus on revenue, they may overlook whether costs are increasing faster than profits.
A connected WiseBI’s CargoWise customs analysis dashboard allows freight forwarders to answer questions such as:
- Is customs revenue growing profitably?
- Which branches generate the strongest customs contribution?
- Are imports or exports performing better?
- Which customers create the most customs value?
- Which transport modes are driving customs activity?
- Are higher job volumes translating into higher profit?
These questions enable freight forwarding executives to gain a better understanding of workload and business value.
Track the Financial Performance of Customs Operations
Financial performance is one of the most important parts of customs performance visibility.
Revenue shows what customs-related work generates, but it does not tell you whether that activity is profitable. Cost provides the missing context.
Profit shows what remains after costs, while profit % helps freight forwarders understand margin quality.
Looking at these measures together is important because higher customs revenue does not always mean stronger performance.
If costs rise faster than revenue, the operation may be handling more business while contributing less profit. A CargoWise customs profitability dashboard helps finance and customs managers see where financial performance is improving and where deeper analysis is needed.
Connect CargoWise Customs Workload with Volume and Count
Volume and count add the operational side of the picture.
A rise in customs jobs may appear positive, but increased activity does not always imply improved performance.
If the number of declarations, documentation, customer communication, and follow-ups increases while profits remain flat, the team may be processing more declarations, documentation, and follow-ups without increasing financial value.
That is why revenue, cost, profit, profit percentage, volume, and count should all be considered together.
This allows freight forwarders to distinguish between:
- Higher customs activity
- Higher revenue
- Better profitability
These do not always yield the same results.
Compare Import and Export Customs Performance
Freight forwarders typically handle both import and export customs activity, and these areas may perform differently.
The dashboard includes a direction-wise split, allowing users to compare import, export, and other customs activities.
This assists customs managers in determining which direction has the greatest impact on the selected KPI.
If imports generate high volume but low profit, or if exports contribute higher margins despite lower activity, the dashboard helps to identify the difference.
This provides freight forwarders with a more precise understanding of where customs performance is coming from.
Compare Customs Performance Across Branches and Departments
For freight forwarders operating across multiple locations, overall customs results can hide branch-level differences.
The branch-wise split shows how each branch contributes to performance, while the department-wise split provides another internal view.
This helps management identify:
- Which branches generate stronger customs profit
- Where customs workload is concentrated
- Which departments contribute more strongly
- Where operational or commercial review may be needed
The value is not simply ranking branches. It is understanding why customers’ performance differs across the business.
Understand Which Customers Drive Customs Profitability
Not every high-volume customer creates the same financial value.
The Customer-Wise Split lets freight forwarders compare customer performance using the selected measure.
This helps commercial and customs teams identify customers that generate strong revenue and profit, as well as accounts that create significant workload but weaker financial contribution.
Because customs clearance is often part of a broader customer relationship, understanding customer customs profitability can support pricing reviews, service discussions, and account-management decisions.
Analyze Customs Performance by Transport Mode
Customs activity is directly connected to freight movement.
The dashboard compares performance across sea, air, road, courier, rail, and other transport modes.
This helps freight forwarders understand where customs activity is concentrated and whether certain modes contribute more strongly to revenue or profit.
For multimodal freight forwarders, this creates a clearer connection between customs performance and the wider transport mix.
Go Deeper with Product and Job-Level Analysis
Overall customs performance can still hide weaker areas underneath.
The BI dashboards’ product-wise split and job-wise split allow users to analyze performance across product and job hierarchies.
This helps teams identify where profit is being created and where losses may be occurring.
Instead of stopping at “customs profit declined,” users can narrow the issue to the specific product or job category behind the change.
That gives operations, finance, and commercial teams a clearer starting point for investigation.
Use Job Status to Understand Workflow Performance
The job-status-wise split adds an operational view to the analysis.
It helps freight forwarders understand where customs jobs are sitting across workflow stages and whether activity is concentrated in certain statuses.
Combined with financial measures, this gives management better context around both customs workflow and business performance.
Track Monthly and Yearly Customs Trends
A single reporting period does not tell the full story.
The BI dashboard includes monthly and yearly trend views, helping freight forwarders understand whether changes in customs revenue, cost, profit, or activity are temporary or part of a longer trend.
This helps teams monitor:
- Growth or decline in customs activity
- Revenue movement
- Cost changes
- Profit improvement or deterioration
- Longer-term performance patterns
Trend analysis gives management better context before making operational or commercial decisions.
Drill Down from Customs KPIs to Individual Jobs
Seeing that performance change is only the first step.
The drill-down view includes job number, year, month, customer, consignee, consignor, country, branch, container mode, department, transport mode, job status, and product information.
Users can filter by customer, year, and individual job.
This creates a practical analysis path:
KPI → trend → branch/customer/product → individual CargoWise job
That helps freight forwarders move from identifying a performance issue to understanding where it is coming from.
Explore CargoWise Customs Data Faster with Conversational BI
WiseBI adds Conversational BI to the CargoWise dashboard experience, allowing freight forwarders to quickly explore customs data and gain relevant insights.
Instead of relying only on filters, users can ask questions such as:
- Which branches generated the strongest customs profit?
- Which import customers have weaker margins?
- Which transport modes contribute most to customs revenue?
- Which customs jobs require closer review?
Follow-up questions can narrow the analysis further, helping teams move from a high-level KPI to the customer, branch, transport mode, or job behind the result.
Dashboard usability also matters when exploring these insights. Visual Header Icons in Power BI provide useful options for interacting with visualizations and navigating dashboard data more effectively.
Conclusion
For freight forwarders, customs performance is about more than completing declarations. It is about understanding how customs activity contributes to revenue, cost, profit, workload, customer value, branch performance, transport modes, products, and job-level results.
A CargoWise customs analysis dashboard brings those insights into one connected view and lets teams drill from high-level KPIs to the jobs behind them.
Schedule a free demo with WiseBI to see how your customs, operations, finance, commercial, and BI teams can turn CargoWise customs data into clearer performance insights.