Managing logistics operations can be difficult when working with multiple areas, services, and customers.
You track revenue, monitor shipments, and manage expenses. But here’s the true challenge: Do you have a complete, real-time view of your company’s global performance?
The CargoWise global insights dashboard can help in this situation. Instead of working with several reports, it consolidates everything, including revenue, gross profit, transportation performance, and service-level insights, into a single, simple perspective.
📈 Why is Visibility More Important than Ever?
Delays, cost changes, and service variations are all common occurrences in today’s logistics environment.
Without clear visibility, teams frequently encounter:
- 📉 Delayed identification of margin changes
- ⏳ Slow response to operational issues
- 📊 Difficulty connecting revenue with performance
- 🔍 Limited insight into service-level contribution
This results in a reactive environment in which decisions are made after issues arise.
CargoWise Global Insights Dashboard
A CargoWise global insights dashboard is a centralized view that consolidates financial and operational data from your entire logistics network.
Instead of analyzing separate reports for revenue, profit, services, and transportation, this dashboard consolidates them into a single, structured view. It enables users to view performance across companies, products, services, and trade lanes without switching between screens.
With this BI dashboard, CargoWise users can:
- 📊 View overall business performance in one place
- 💰 Track revenue, gross profit, and margin trends
- 🌍 Analyze performance across multiple companies and branches
- 🚢 Understand service and transport-level contributions
- 🔎 Identify trends, gaps, and performance patterns quickly
This provides a single source of truth for decision-making.
🔎 From Data to Operational Clarity
CargoWise collects a wide range of operational and financial data, but the true value lies in how that data is used.
When properly structured, it can help teams understand:
- 💰 Revenue Generation Across Services
- 📊 Are profit margins increasing or decreasing?
- 🚢 What operational areas impact performance?
- 🌍 Contributions from various regions and entities
This level of clarity transforms raw data into valuable business insights.
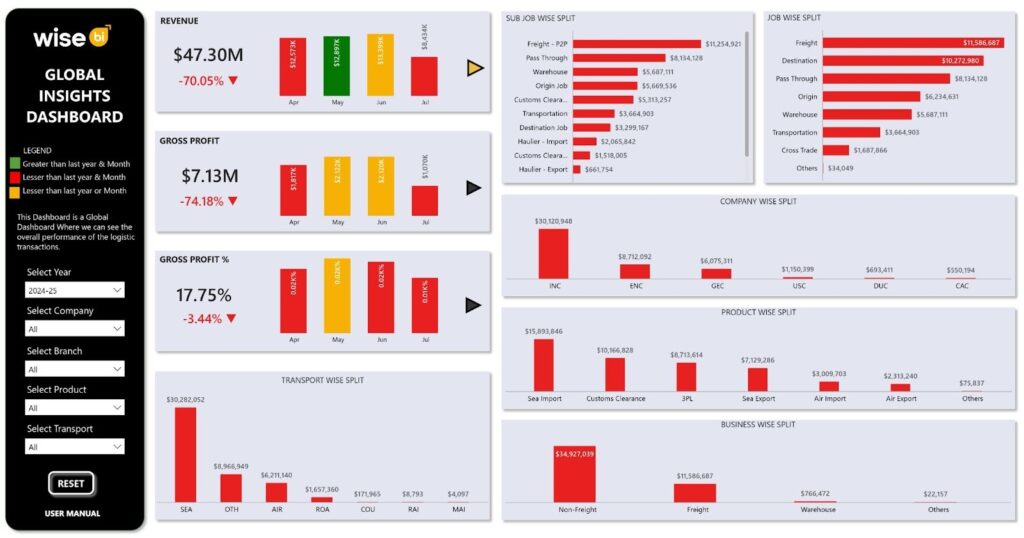
📊 Understanding the Revenue-Profit Gap
One of the most important outcomes from the CargoWise global insights dashboard is the correlation between revenue and gross profit.
Revenue reflects business activity, whereas gross profit and margin demonstrate efficiency.
Key findings include:
- 💰 Revenue trends fluctuate across periods, reflecting demand changes
- 📉 Gross profit movements indicate margin pressure
- 📊 Profit percentage highlights operational efficiency
This displays:
High revenue does not always mean high profitability
Margin visibility is critical for sustainable growth
🚢 Service-Level Contribution: What Drives the Business?
The BI dashboard shows how various services contribute to performance.
Key insights include:
- 🚢 Freight services drive a major share of operations
- 📦 Origin and destination services contribute significantly
- 🚚 Transportation and warehouse support core execution
- 🌍 Cross-trade adds strategic value
This helps to answer:
- What services generate revenue?
- Which services make operational delivery possible?
🌐 Product-Level Performance: Identifying Core Revenue Streams
Product-level insights indicate where business activity is concentrated.
The BI dashboard indicates:
- 📦 Sea-based services form a major share of operations
- 📊 Customs clearance contributes strongly
- 🏭 3PL services add significant value
- ✈️ Air freight plays a specialized role
This reflects:
- Core services drive volume
- Value-added services improve margins
🚛 Transport-Level Trends: How Cargo is Moving?
Transportation insights reveal how shipments move through the network.
The BI dashboard shows:
- 🚢 Sea transport dominates cargo movement
- ✈️ Air freight supports time-sensitive shipments
- 🚛 Road transport handles regional distribution
- 🚆 Other modes serve niche requirements
This helps teams get a better idea of:
- Operational reliance on transportation modes
- How does the mix of transportation affect costs and efficiency?
🏢 Company-Wise Performance: Uneven Distribution of Revenue
Performance across businesses is not always balanced.
The BI dashboard highlights:
- 📊 Certain companies contribute a large portion of revenue
- 📉 Others contribute less
- 📍 Performance is concentrated in specific entities
This insight helps leadership:
- Focus on high-performing units
- Improve underperforming areas
📦 Business Mix: Freight vs Non-Freight
Another important takeaway is the business composition.
Insights show:
- 🚢 Non-freight activities contribute significantly
- 📦 Freight remains core but is part of a broader mix
- 🏢 Additional services support overall revenue
This indicates:
- Logistics is evolving beyond freight
- Diversification strengthens business stability
🔎 What does this Mean for CargoWise Users?
When these insights come together:
- 📊 Performance becomes easier to understand
- 📉 Profitability gaps become visible
- 🌍 Operational patterns become clearer
- 🏢 Business contributions can be compared
- 🚛 Strategy can be adjusted based on real data
Without a CargoWise global insights dashboard, these insights remain scattered.
🚀 Final Thoughts
The CargoWise Global Insights Dashboard simplifies complex logistics operations by combining financial and operational data into a single view. It enables teams to move beyond isolated reporting and understand how various aspects of the business contribute to overall performance.
Ready to turn CargoWise’s global data into actionable insights? The logistics BI solution converts CargoWise data into interactive BI dashboards, allowing for deeper analysis, faster decisions, and improved operational control across your logistics network.