Without data, you are just another person expressing an opinion. Your logistics company generates data every minute.
Shipments are moving across countries. Warehouses are processing inventory. Customs entries are being cleared. Customers are asking for updates. Finance teams are raising invoices. Operations teams are managing exceptions.
So the problem isn’t a lack of data.
The real issue is that your data is spread across multiple systems, spreadsheets, reports, branches, and teams. For many logistics and supply chain companies, business performance is still reviewed through manual reports, Excel files, and disconnected updates. By the time the numbers are collected, checked, and shared, the information may already be outdated.
Sounds familiar?
If your team spends more time creating reports than utilizing insights, your company may be ready for a business intelligence (BI) dashboard.
Here are five clear indications that it is time to move beyond traditional reporting and begin making faster, data-driven decisions.
Why has Data Visibility Become a Competitive Advantage?
Logistics have become more complex than ever. Today’s businesses manage multiple branches, modes of transportation, warehouses, customs operations, customers, products, and service lines all at once. Each activity generates valuable operational and financial data.
But many teams still struggle to answer basic questions quickly:
- Which customers are most profitable?
- Which services generate the best margins?
- Which branches need attention?
- Where are delays or bottlenecks happening?
- Are costs rising faster than revenue?
When leaders are unable to find answers quickly, opportunities are missed, and risks remain hidden.
This is where a logistics BI solution comes into its own. Instead of manually combining reports, you get a single, clear picture of business performance that helps teams understand what is happening, why it is happening, and where to go next.
Sign 1: Your Team Spends Hours Building Reports Every Week
If your team exports data on a regular basis, updates spreadsheets, and prepares management reports manually, this is a major red flag.
Many logistics companies still rely on:
- Excel spreadsheets
- ERP exports
- Warehouse reports
- Transport reports
- Finance summaries
- Branch-level updates
The outcome is straightforward: teams spend more time gathering information than analyzing it.
The business intelligence dashboard alters the process. It automates reporting and consolidates key metrics into a single location, allowing leadership teams to gain performance insights without having to wait for manual updates.
Instead of asking, “Can somebody prepare that report?”
You can open your BI dashboard and get the answer.
Sign 2: Different Teams Work with Different Numbers
Have you ever attended a meeting where operations, finance, and management all provided different numbers for the same metric?
It happens more frequently than most businesses want to admit.
Disconnected reporting leads to multiple versions of the truth. Operations may track shipment volume in one way, finance may calculate revenue in another, and branch managers may maintain separate spreadsheets.
This leads to confusion, slows decision-making, and lowers confidence in the data.
BI dashboards provide your business with a single source of truth. It combines data from multiple systems into a single connected view, allowing everyone to work from the same numbers.
This means fewer debates, faster decisions, and greater accountability.
Sign 3: You Know What Happened, But Not Why it Happened
Traditional reports are effective for displaying results.
But they frequently stop there.
You may know that:
- Revenue dropped last month
- Gross profit percentage declined
- Warehouse costs increased
- Shipment volume changed
- A branch underperformed
But the real question is, why?
Without better visibility, your team may spend hours combing through various reports to find the root cause.
The logistics BI dashboard enables you to connect the dots. You can track performance by customer, branch, product, mode of transportation, service type, country, and business unit.
This more in-depth perspective allows you to understand the cause of performance changes rather than just the outcome.
Sign 4: Your Decisions Feel Reactive, Not Proactive
Many logistics companies operate in reaction mode.
Problems are only revealed during monthly reviews, quarterly meetings, or when customers start complaining. By then, the damage may have already been done.
For example:
- Margins may have been declining for months
- A key customer may be reducing shipment volume
- Operational costs may be rising slowly
- A branch may be underperforming
- Delays may be affecting service quality
Without timely visibility, these issues remain hidden until they have an impact on profitability.
A BI dashboard allows you to identify patterns more quickly. Instead of reacting when the problem worsens, your team can act while there is still time to fix it.
One of business intelligence’s most significant benefits is the shift from reactive reporting to proactive decision-making.
Sign 5: Leadership Cannot See the Full Business Picture Easily
As logistics companies expand, data fragmentation increases.
Executives frequently have to review multiple reports to understand:
- Financial performance
- Operational efficiency
- Customer activity
- Branch profitability
- Transport performance
- Warehouse productivity
- Revenue and cost trends
The larger the company grows, the more difficult it is to obtain a comprehensive view.
The logistics BI dashboard consolidates all information into a single executive-level view. Leadership teams, branch managers, finance teams, and operations teams can all find the information they need without having to sift through dozens of files.
This increases transparency, accountability, and confidence throughout the organization.
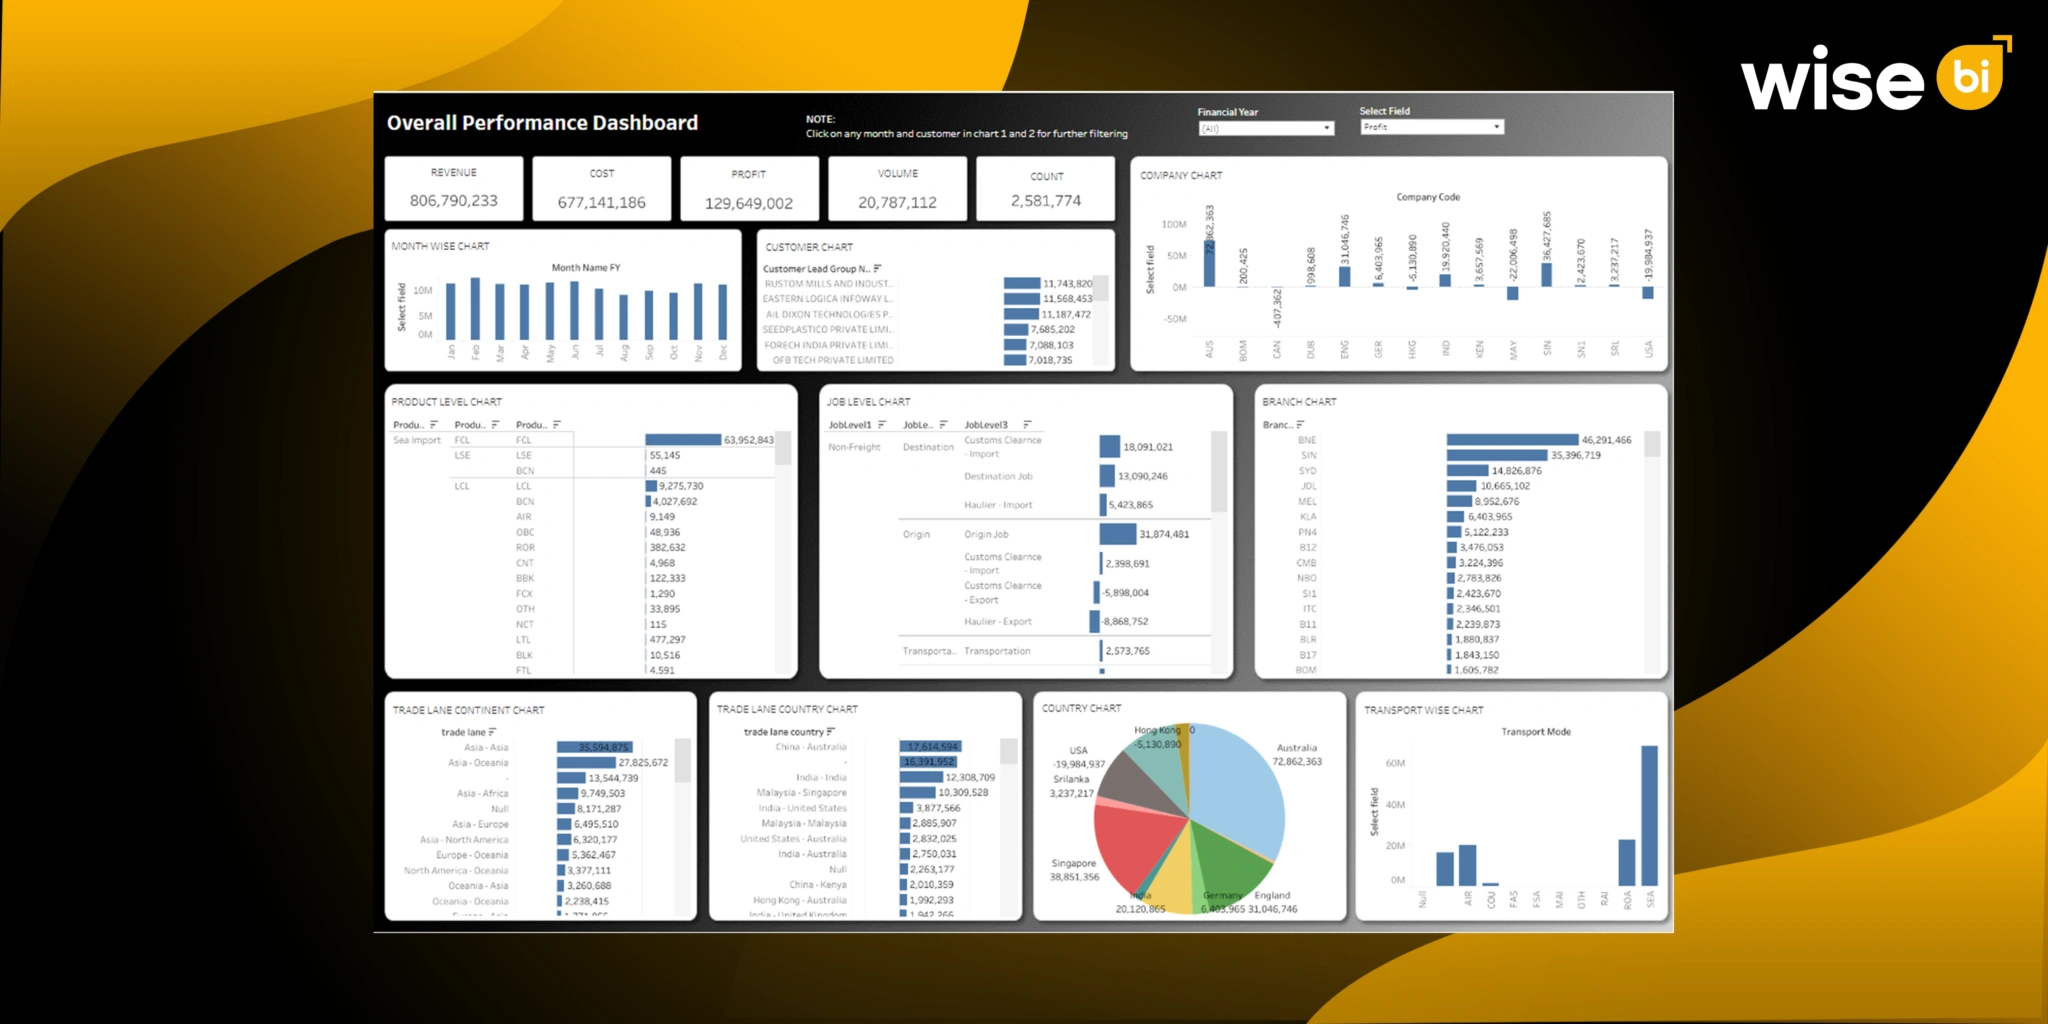
What can a Logistics BI Dashboard Help You Track?
A modern logistics BI dashboard allows you to monitor the metrics that are most important to your business.
Financial Performance
- Revenue
- Gross profit
- Gross profit percentage
- Cost trends
- Customer profitability
- Branch profitability
Operational Performance
- Shipment analysis
- Job volume
- Warehouse operation
- Customs performance
- Transport visibility
- Service-level performance
Business Growth Metrics
- Branch performance
- Product performance
- Customer trends
- Transport mode analysis
- Regional performance
- Business unit performance
When these metrics are all in one place, your team can focus on improving performance rather than creating reports.
Why are Logistics Companies Investing in and Implementing BI Dashboards?
Year after year, the logistics industry becomes more data-driven.
Customers expect quicker updates. The margins are under pressure. Supply chains are becoming increasingly complex. Operations teams require greater visibility, while leadership teams require faster responses.
That is why more logistics and supply chain companies are implementing BI dashboards.
A BI dashboard helps companies
- Improve business visibility
- Reduce manual reporting time
- Identify profit and cost trends earlier
- Improve operational efficiency
- Support faster decision-making
- Build stronger customer and branch performance reviews
Businesses that act on insights quickly are better able to control costs, protect margins, and improve service quality.
Conclusion
If your logistics company’s team spends too much time preparing reports, works with inconsistent numbers, struggles to identify root causes, responds late to problems, or cannot see the big picture clearly, a BI dashboard can be necessary.
The right dashboard does more than simply display data.
It helps you understand what’s going on in your company, why it’s happening, and what steps should be taken next. In logistics, speed, visibility, and profitability are all closely linked. When your data is more understandable, you can make better decisions.
Your logistics systems already hold valuable business insights.
The question is, can you see them clearly?
Wise BI helps logistics and supply chain companies in transforming operational and financial data into actionable dashboards that facilitate real-world business decisions. Schedule a free demo today to see how Wise BI can help you improve visibility, reduce reporting effort, and make more confident decisions.