Every day, logistics operations generate thousands of data points across shipments, customers, warehouses, and finances.
Whether your company uses CargoWise, Magaya, GoFreight, project44, Infor, or a combination of these systems, there is no shortage of shipment records, customer information, costs, invoices, milestones, transportation updates, carrier data, and operational reports.
But here’s the real question:
Can your team use that data to make decisions quickly enough?
Because in modern logistics, having reports is not the same as having clarity.
Many freight forwarders, 3PLs, customs brokers, transport teams, and warehouse operators continue to spend hours pulling reports, exporting files, comparing spreadsheets, and manually connecting operational and financial data. That may work when everything is quiet. However, when volumes increase, costs shift, customers request updates, or margins tighten, delayed insight becomes a significant issue.
📊 Why is Standard ERP Reporting Becoming a Greater Challenge?
Logistics ERP systems and platforms are extremely effective. CargoWise manages global logistics execution and cargo operations; Magaya offers freight, warehousing, accounting, visibility, and compliance capabilities; project44 specializes in supply chain visibility; and Infor supports enterprise supply chain and logistics operations.
Each system has an important function.
However, reporting can still be difficult when teams need to answer business questions that span multiple areas, such as:
- 📦 Which shipments are delayed or underperforming?
- 💰 Which customers are profitable?
- 🚚 Which carriers or hauliers are creating delays?
- 📊 Which branches are growing but losing margin?
- ⏱️ Where are average transit times increasing?
- 🧾 Which invoices, costs, or accruals need attention?
The problem is not always with the ERP itself. The challenge is that business questions frequently necessitate data from multiple reports, modules, systems, or departments.
📈 What Recent Trends are Showing?
According to recent research, logistics and supply chain teams are rapidly adopting analytics-driven operations, real-time monitoring, automation, and connected decision-making. The supply chain analytics market is expected to be worth USD 10.97 billion in 2026 and grow to USD 24.13 billion by 2031, reflecting rising demand for better forecasting, visibility, and operational control.
Another recent market estimate forecasts that the supply chain visibility software market will grow from USD 3.10 billion in 2025 to USD 11.89 billion by 2036. This growth is understandable given the pressure on logistics teams to improve visibility, reduce delays, control costs, and make faster decisions.
In simple terms, the industry is moving away from static reporting and toward real-time performance insight.
🚨The Real Pain Point: Too Many Reports, Not Enough Answers
Let us be honest. Most logistics teams do not want additional reports.
They are seeking answers.
A manager may need to know why profits have dropped. Operations may need to determine which shipments are stuck. Finance may wish to compare revenue, costs, and margins. Customer service may require quick updates. Leadership may want a unified view of branches, services, and customers.
However, in many companies, getting these answers means:
- 📄 Pulling multiple ERP reports
- 🧩 Combining data manually in spreadsheets
- 🔁 Checking different modules or systems
- ⏳ Waiting for someone to validate numbers
- 📉 Finding issues after they already affect performance
- 📧 Following up across teams for missing context
This is where reporting becomes a bottleneck.
Instead of accelerating team progress, the reporting process slows down decision-making.
💡Why are BI Dashboards Becoming More Important?
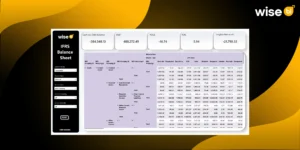
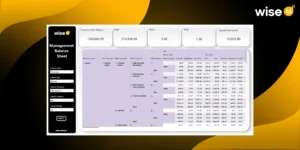
The BI dashboard consolidates data from ERP systems, visibility platforms, finance tools, customer portals, transportation systems, warehouse systems, and spreadsheets into a unified view.
The business intelligence layer can assist teams using CargoWise, Magaya, GoFreight, project44, Infor, or other logistics systems in transforming disparate data into actionable insights.
A good BI dashboard allows teams to monitor:
- 📦 Precise revenue and volume performance
- 💰 Shipment, cost, margin, and gross profit
- 👥 Customer insights impact profitability
- 🚚 Carrier, haulier, and transport performance
- 🌍 Branch, trade lane, country, and service performance
- ⏱️ Transit time, milestone performance, and delays
- ⚠️ Exceptions that need immediate attention
This is where the transition occurs.
Teams go from:
“Let me pull the report.”
to:
“Let me take action based on this insight.”
🔗 Why is Multi-Source Data Integration Important?
Most logistics companies do not use a centralized system.
A forwarder might use CargoWise for operations, a finance system for accounting, project44 for visibility, a warehouse system for inventory, a customer portal for updates, and spreadsheets for internal tracking.
When these systems are not integrated for reporting, teams are forced to manually compare data.
Business intelligence can help by consolidating multiple sources into a single reporting layer. This means that operations, finance, sales, management, and customer service can all work from the same performance view rather than debating different versions of the numbers.
That alignment is a big deal.
Because when everyone sees the same data, decisions are made faster and with more confidence.
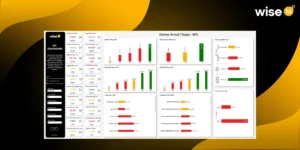
🔍 What Benefits does Drill-Down Capability on BI Dashboards Provide?
High-level BI dashboards are useful, but logistics teams must also understand the underlying numbers.
This is where drill-down capability comes into its own.
Instead of just seeing total revenue, delayed jobs, or margin trends, teams can drill down by:
- customer
- shipment
- job
- branch
- carrier
- trade lane
- product
- service
- department
This allows teams to understand not only what happened but also why it happened.
That is the distinction between standard reporting and actual business intelligence.
✅ Quick Check for Your Team
Take a minute and ask yourself:
- Can your team see overall performance without pulling multiple reports?
- Do operations and finance work from the same numbers?
- Can managers quickly identify margin pressure or service delays?
- Are customer, carrier, branch, and trade lane trends easy to compare?
- Can users drill down from high-level performance into job-level details?
- Are decisions based on live insight or delayed reporting?
If the answers are unclear, the problem may not be missing data.
It may be that your data is locked up inside too many separate reports.
🎯 Final Thoughts
Logistics ERP reports are important. They give teams access to operational and financial data.
But reports alone are no longer enough for modern logistics operations.
Today’s teams need connected insight, real-time visibility, multi-source reporting, and drill-down capability to understand performance faster and act with confidence.
Because in logistics, better decisions do not come from more reports. They come from clearer insights.
If your team still spends too much time generating reports, comparing spreadsheets, or waiting for performance updates, it may be time to simplify your reporting process.
The logistics BI solution can transform data from CargoWise, Magaya, GoFreight, Project44, Infor, and other logistics systems into clear, actionable dashboards, allowing your team to reduce reporting delays, improve visibility, track performance, and make better decisions on a daily basis.