Logistics teams no longer have a data problem. They have a visibility issue.
Every day, CargoWise collects valuable data, including shipments, jobs, invoices, costs, margins, customers, branches, trade lanes, milestones, and performance history. However, when teams rely solely on standard reports, answers are frequently delayed.
The actual challenge is this:
Can your team convert CargoWise data into decisions quickly enough?
Because even when data is stored in standard reports, spreadsheets, or disconnected views, teams still react late. In logistics, late visibility can quickly lead to delayed shipments, missed margins, billing issues, and dissatisfied customers.
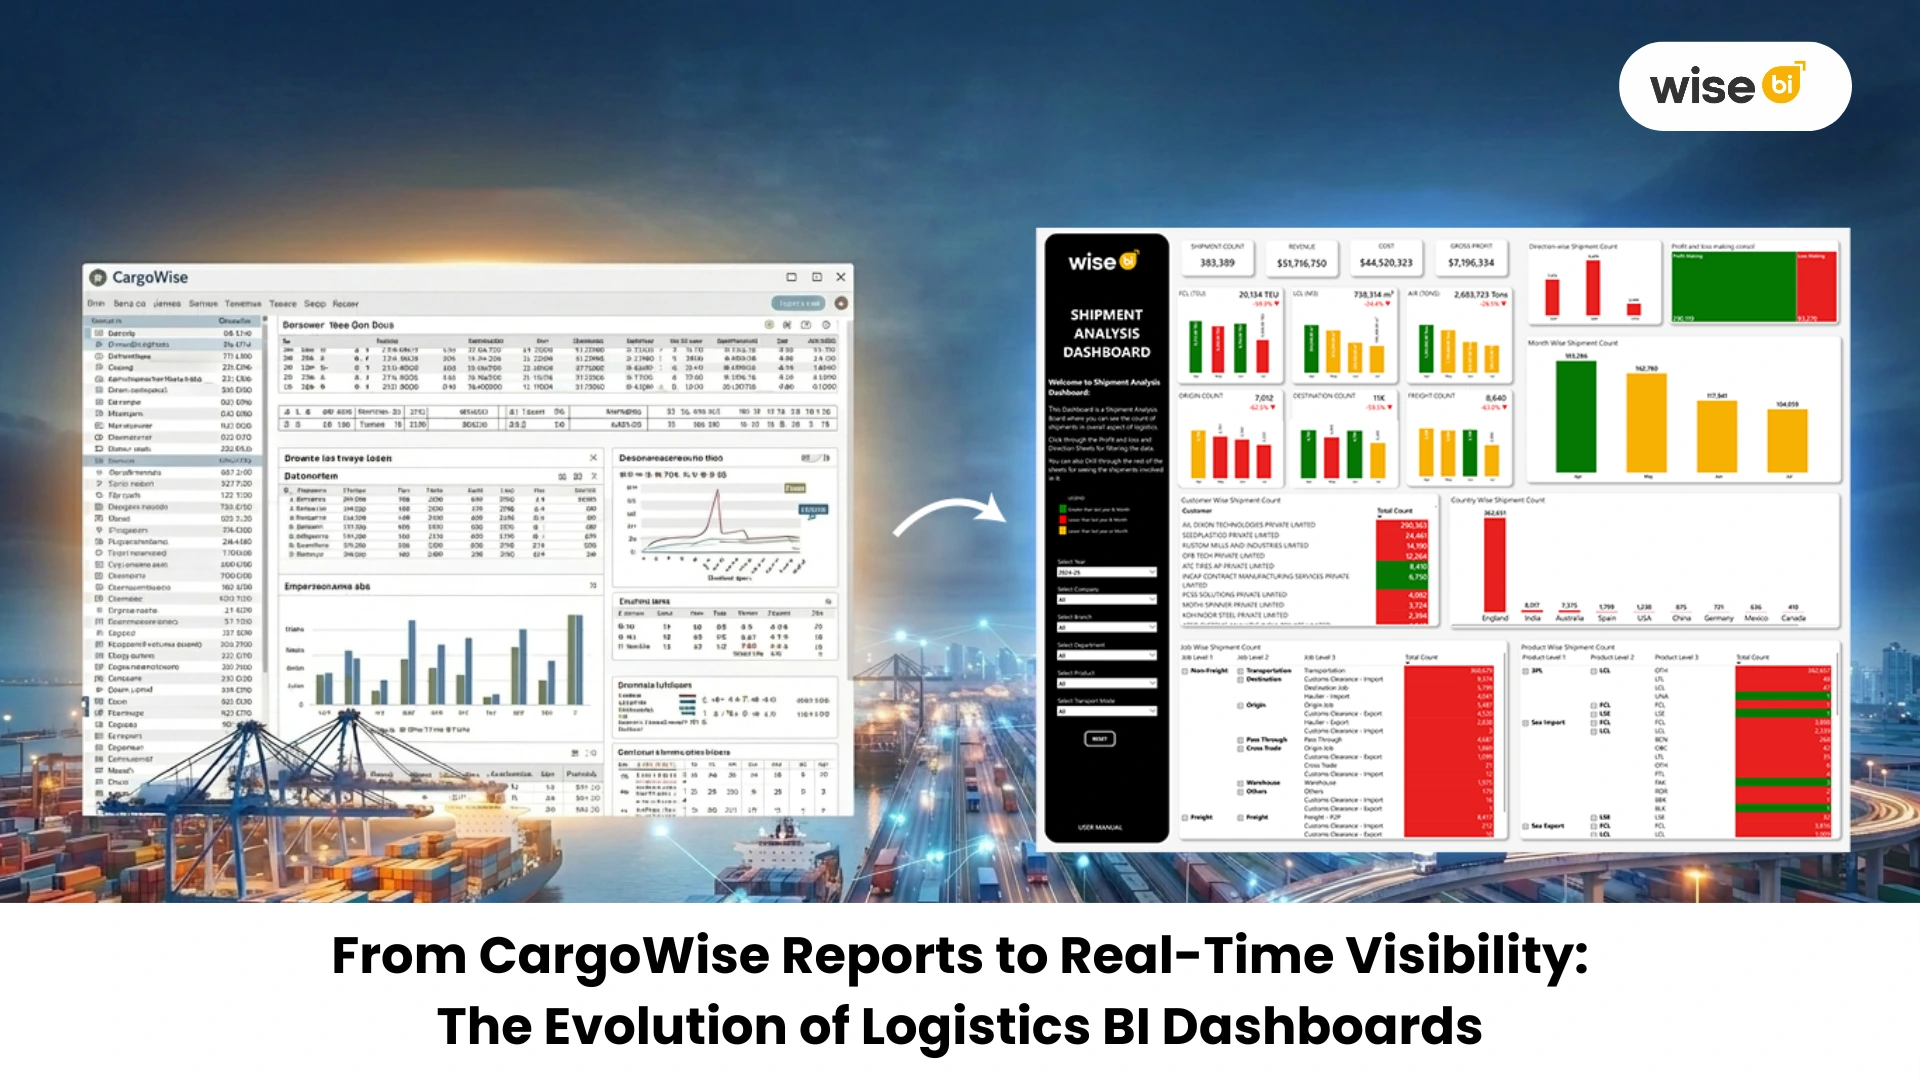
From CargoWise data to decisions: That’s why logistics companies prefer Power BI dashboards instead of reports.
The goal is simple: instead of spending hours pulling reports, focus on what needs to be done right now.
🌍Why is Real-Time Data Visibility a Big Deal?
Visibility has emerged as a critical business requirement throughout global supply chains. Customers prefer faster updates. Operational teams require early warning signs. Finance teams want accurate margin visibility. Leadership wants a clear picture of performance without the need for manual reporting.
Spreadsheets and manual reports can no longer keep up with that pace.
Traditional reports usually help to explain what happened. However, today’s teams must understand what is happening now and what needs to be addressed next.
This shift is influencing how CargoWise users think about reporting.
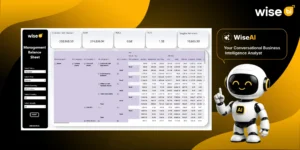
📊 The Problem with Traditional CargoWise Reporting
CargoWise reports are useful. They give teams access to critical operational and financial data.
However, standard CargoWise reports typically include what happened as well as static.
Common reporting gaps include:
- 📄 Data spread across multiple reports and modules
- 🧩 Manual spreadsheet work to connect information
- ⏳ Delayed visibility into margins, costs, and service issues
- 🔍 Difficulty comparing customers, branches, departments, or trade lanes
- 📉 Problems identified only after they affect performance
The problem isn’t that CargoWise lacks data. The problem is that teams require a faster way to interpret it.
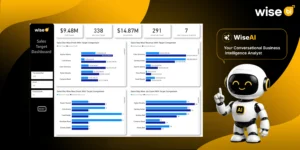
🚀 How do Logistics BI Dashboards Change the Game?
A logistics BI dashboard built on CargoWise data consolidates key performance data into a single, connected view, making trends, exceptions, and performance signals easier to identify.
Multi-source data integration allows teams to combine CargoWise, finance systems, customer portals, carrier platforms, warehouse tools, and spreadsheets into a single reporting layer, reducing manual comparisons and disconnected reporting.
Users can drill down from high-level numbers to explore details by customer, branch, job, shipment, trade lane, department, or service. This allows teams to understand not only what happened but also why it happened.
With these capabilities, BI dashboards help teams monitor:
- 📦 Shipment volume and job performance
- 💰 Revenue, cost, margin, and gross profit trends
- 👥 Customer contribution and profitability
- 🌍 Branch, country, and trade lane performance
- 🚢 Product, service, and transport-mode performance
- ⏱️ Delays, average days, and milestone performance
- ⚠️ Exceptions that need immediate attention
This is where BI dashboards shift from simple reporting tools to real decision-making systems.
📌 Why do CargoWise Users Need BI Dashboards?
CargoWise is a cloud-based ERP system. It stores the data necessary to run freight, customs, warehousing, transportation, finance, and customer workflows.
However, most leadership teams require more than just transactional records. They need answers.
For example:
- Which customers are profitable?
- Which branches are underperforming?
- Which services create the strongest margins?
- Where are costs increasing?
- Which shipments are taking longer than expected?
- Which departments need attention?
These questions are difficult to answer quickly when teams rely solely on standard reports.
BI dashboards help to close that gap by transforming CargoWise data into simple, visual, real-time insights.
Teams can:
- ⚡ identify performance changes early
- 📊 Compare business units more easily
- 💰 understand profitability beyond revenue
- 🔍 spot risks before they grow
- 🤝 align operations, finance, and management on the same view
That alignment is critical because logistics performance is not controlled by a single department. Operations, finance, sales, customer service, and leadership rely on the same data.
📊 From Static Reporting to Real-Time Control
The biggest distinction between reports and BI dashboards is timing.
Reports frequently describe the past. Business intelligence enables you to manage the present and allows teams to detect signals earlier and take action before they have a larger impact.
This does not replace CargoWise reporting. It enhances it.
CargoWise remains the operational foundation. BI dashboards become the visibility layer, allowing teams to understand and act on data more quickly.
🚀 Final Thoughts
The transition from CargoWise reports to real-time BI dashboards is more than just better charts and cleaner visuals. It is about transforming the way logistics teams make decisions.
In today’s freight environment, success is dependent on speed, accuracy, and clarity.
Because winning teams do not have the most reports. They are the ones who understand their data the quickest.
Turn CargoWise data into real-time business visibility. A logistics BI solution can transform CargoWise data into clear, real-time BI dashboards, helping you track operations, monitor profitability, reduce reporting delays, and make smarter decisions every day.