What happens if your logistics team spends more time creating reports than improving performance?
Every week, operations teams export data from ERP systems, finance teams update spreadsheets, and managers wait for answers that should already be available.
The issue is not a lack of data.
The data is stuck inside Excel.
For years, spreadsheets have been the go-to reporting tool for logistics businesses. They’re familiar, flexible, and easy to use. But as shipment volumes grow, customer expectations increase, and margins become tighter, Excel-based reporting is becoming a limitation rather than a business advantage.
📊 Why is this Shift Happening Now?
The logistics industry is generating more operational and financial data than ever before.
Every shipment, invoice, milestone, carrier update, warehouse transaction, and customer interaction creates valuable information. Yet many businesses still rely on manual reporting processes to turn that data into insight.
As supply chains become more complex, leaders are under increasing pressure to answer critical questions quickly:
- Which customers are most profitable?
- Which trade lanes are underperforming?
- Where are costs increasing?
- Which branches are driving growth?
- Which shipments require immediate attention?
When answers depend on manually updated spreadsheets, decision-making slows down.
⚠️ The Problem with Excel-Based Reporting
Excel remains a useful business tool, but it was never designed to be the primary control tower for modern logistics operations.
Many logistics teams still face challenges such as:
- 📄 Manual report preparation every week or month
- 🔁 Data copied from multiple systems into spreadsheets
- ⚠️ Formula errors and version control issues
- 📧 Multiple departments working from different reports
- ⏳ Delayed visibility into operational and financial performance
- 📉 Decisions based on outdated information
As businesses grow, these challenges multiply.
The result is not only inefficient reporting but also lost time, slower decision-making, and reduced visibility into performance.
🚛 Where do Logistics Teams Feel the Most Pain?
Timing is extremely important in logistics.
If margins begin to decline, leadership must act quickly.
If a customer relationship becomes unprofitable, teams must be aware of this before the end of the month.
If a branch falls behind on performance targets, management cannot afford to find out weeks later.
However, many teams spend valuable time asking:
- Which report contains the latest numbers?
- Why don’t finance and operations match?
- Has this spreadsheet been updated?
- Which version should we trust?
When teams spend more time validating reports than acting on insights, reporting has become the problem.
🚀 How do Real-Time BI Dashboards Change the Game?
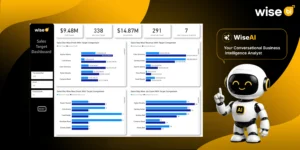
Real-time BI dashboards are changing how logistics companies use data.
Instead of manually gathering information from ERP, finance, warehouse, transport, and customer systems, dashboards provide a single source of truth for the entire business.
With real-time visibility, teams can monitor:
- 📦 Shipment and job performance
- 💰 Revenue, costs, margins, and profitability
- 👥 Customer profitability and growth trends
- 🚚 Carrier and transport performance
- 🌍 Branch, country, and trade lane performance
- ⏱️ Milestone and transit-time performance
- ⚠️ Operational exceptions requiring attention
Instead of asking someone to prepare a report, decision-makers can access answers instantly and take action.
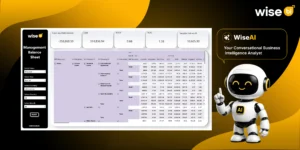
📊 One Version of the Truth
Most logistics businesses do not run on a single system.
A company may use CargoWise, Magaya, GoFreight, Infor, SAP, Oracle, project44, financial tools, customer portals, warehouse systems, carrier platforms, and spreadsheets.
When data remains separated across these systems, teams are forced to compare information manually.
A business intelligence solution brings these sources together into a unified reporting layer, enabling operations, finance, sales, customer service, and leadership teams to work from the same numbers.
No more conflicting reports.
No more spreadsheet comparisons.
No more uncertainty.
Just visibility.
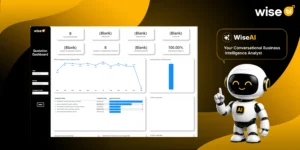
🔍 Understanding the Story Behind the Numbers
High-level KPIs tell you what happened.
A BI dashboard helps you understand why.
For example, if profit decreases, the BI dashboard should allow users to drill into performance by:
- Customer
- Job
- Shipment
- Branch
- Department
- Carrier
- Trade Lane
- Product or Service
This level of visibility helps leaders identify root causes, uncover opportunities, and make informed decisions faster.
That is where reporting becomes true business intelligence.
✅ Quick Reality Check
Ask yourself:
✔ Are reports still being prepared manually?
✔ Do different departments sometimes work from different numbers?
✔ Is data cleaning delaying reporting cycles?
✔ Can managers instantly view margin and customer performance?
✔ Can users drill from KPIs down to shipment-level details?
✔ Are decisions based on real-time insights or yesterday’s spreadsheets?
If these questions feel familiar, your business may not have a data problem. It may have a reporting problem.
🚀 Final Thoughts
Excel will always have a business place. But it should not be the primary decision-making platform for modern logistics operations. Today’s logistics leaders need real-time visibility, connected data, and actionable insights that help teams identify issues early, improve performance, and make faster decisions.
Organizations that achieve a competitive advantage do not collect more data. Those who make better use of the information they already possess.
The question is no longer whether your company has sufficient data. The question is whether your team can convert that data into decisions quickly enough.
Ready to move beyond spreadsheets?
The logistics BI solution can connect data from your ERP, finance, transport, warehouse, and visibility systems into real-time dashboards that deliver faster insights, greater visibility, and better business decisions.
Reduce manual reporting. Improve operational visibility. Empower every team with trusted data. Better decisions don’t come from more spreadsheets. They come from better insights.