


Shipment Count
Monitor total ocean freight shipments across the selected period.

Curated dashboards plus predictive insights that recommend your next move
Tailored BI engineering — bespoke dashboards, data models and integrations built around your logistics stack.
Insights, playbooks and product thinking from the Wise BI team.
200+ logistics & BI terms explained in plain language — from chargeable weight to demurrage.
Deep-dive playbooks on freight analytics, BI adoption and dashboard rollouts — free to download.
See how teams apply Wise BI across quoting, operations, finance and customer success.
Product tours, feature deep-dives and webinar recordings from the Wise BI team.
The team building logistics intelligence for freight-forwarders worldwide.
Questions, demos or partnerships — we reply within one business day.
Duty, compliance and clearance visibility for every customs house.
Duty, compliance and clearance visibility for every customs house.
End-to-end forwarding analytics across air, ocean and road.
Production, inventory and supplier performance on one screen.
Container, slot and vessel analytics for NVOCC operators.
Fleet, route and haulage intelligence for transport teams.
Warehouse throughput, picking and storage insights.
Multi-client billing, SLAs and operations visibility.

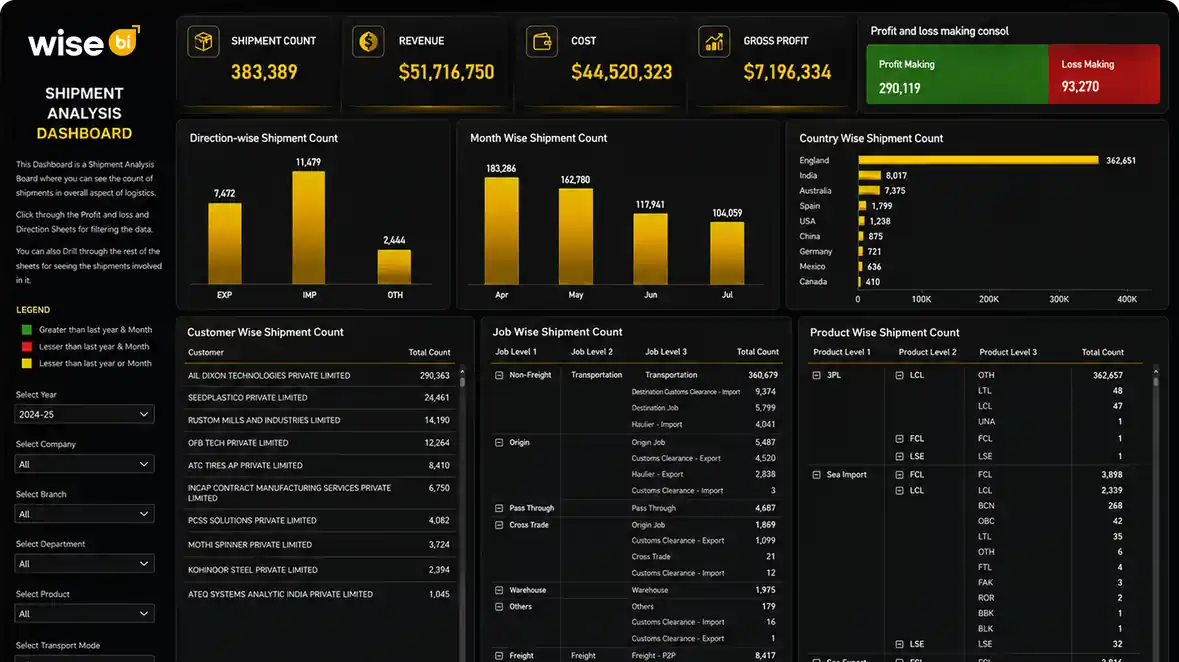
See ocean freight volume, container movement, cost, and efficiency across your logistics business in one connected view.

The Problem
Fragmented ocean freight data makes it difficult for teams to monitor volume, cost, and transit performance with confidence every day.

Shipment count, chargeable volume, cost, and transit days sit in separate systems.

Changes in volume, cost, and transit time are often identified too late.

Port-to-port totals do not show which lanes carry volume or run slower.

Static reports make it difficult to compare months, quarters, and previous years.
Solution: Clear insight into ocean freight cost, volume, and transit performance.
Capability Overview
The Ocean Freight Insights Dashboard brings shipment activity, chargeable volume, freight costs, transit performance, and trade lane analysis into one interactive view for real-time monitoring and comparison across the entire logistics network.

Monitor key operational metrics across your complete ocean freight business and network.
 Track shipment countReview chargeable volume (m³)Monitor ocean freight costs
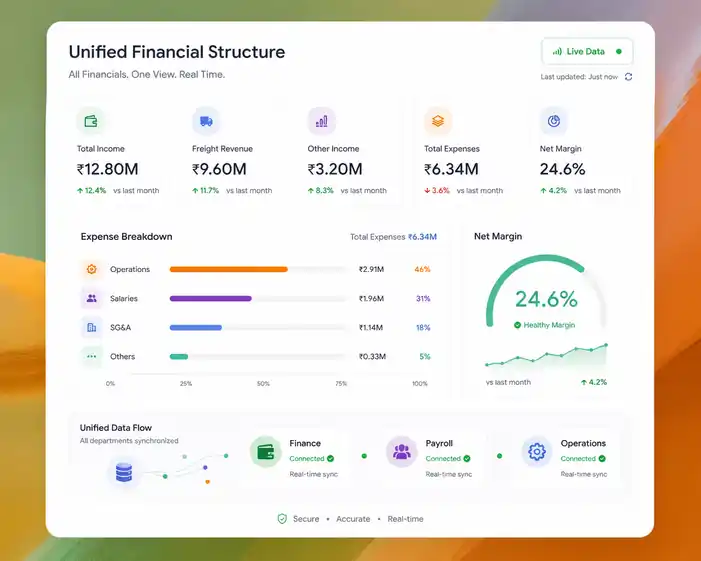
Understand how freight moves across ports, trade lanes, companies, and reporting periods.
Compare trade lane portsReview volume contributionMeasure average transit days
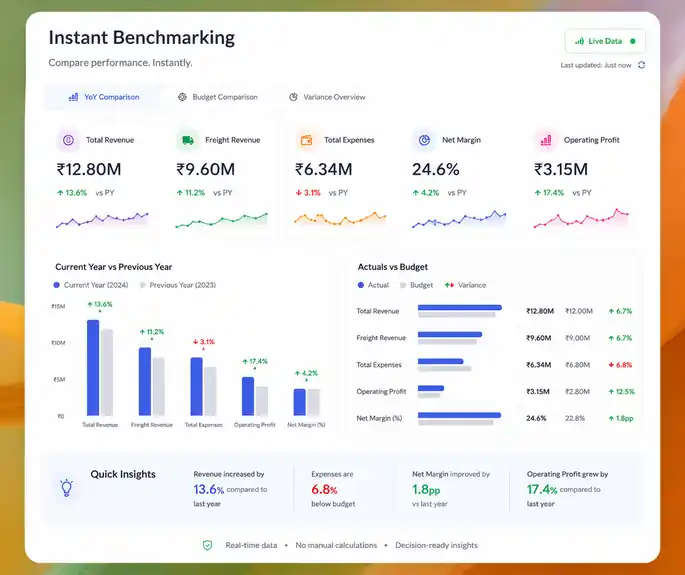
Evaluate ocean freight performance across monthly, quarterly, yearly, and comparative reporting periods.
Compare the current year with the previous yearAnalyze monthly trendsReview quarter-wise performance
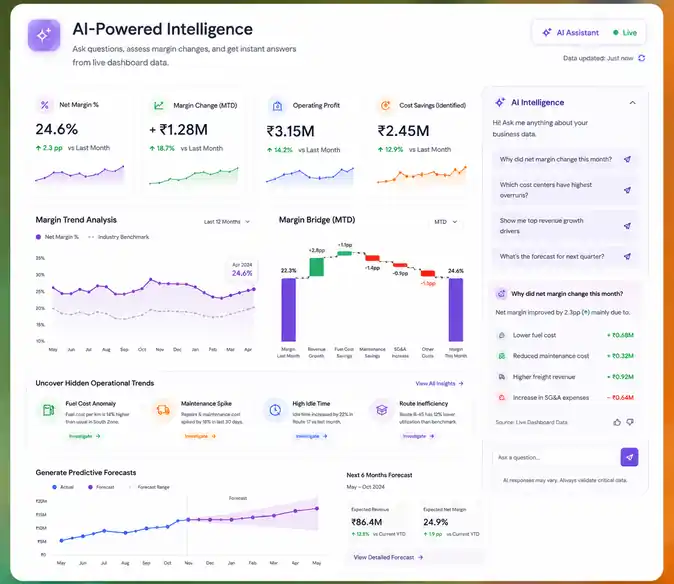
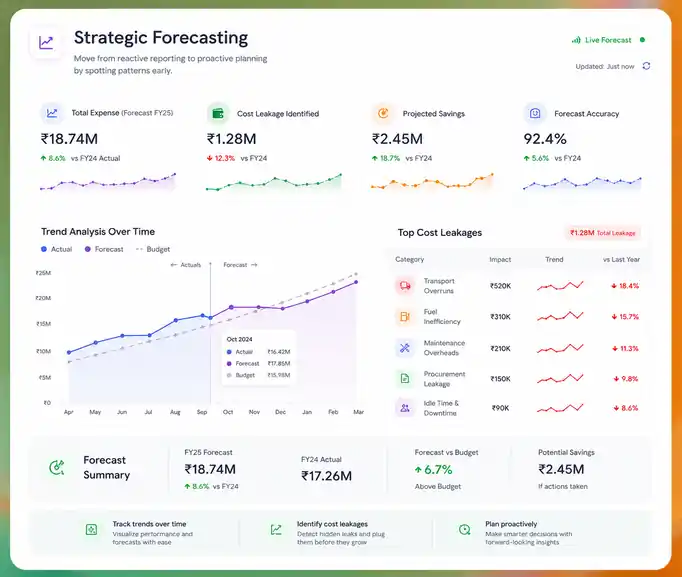
Monitor operational efficiency across the ocean freight network using volume and transit.
Analyze transit time trendsCompare operational performanceEvaluate company-wise activityMetric Index
Monitor ocean shipment activity, cost, volume, and transit performance from summary to record level.
Shipment Count
Monitor total ocean freight shipments across the selected period.
Chargeable Volume
Track chargeable cargo volume in cubic metres.
Ocean Freight Cost
Review total ocean freight costs and operational spending.
Average Transit Days
Measure the average time shipments take to complete their journey.
Trade Lane Performance
Compare port-to-port lanes using volume and transit days.
Volume Distribution
Understand how freight volume is distributed across major lanes.
Who Benefits from this Dashboard?

Monitor shipment activity, trade lane performance, transit days, and operational efficiency.

Track shipment volume, freight costs, and performance trends to improve daily operations.

Analyze trade lane activity, chargeable volume, and transit performance to optimize planning.

Review company-wide ocean freight performance to support faster operational decisions.
Our dashboard links shipment activity, chargeable volume, freight cost, and transit efficiency, helping teams quickly identify trade lane trends and operational changes. Instead of reviewing disconnected reports, teams gain real-time ocean freight insights.
Key Outcomes:
 Monitor shipment count and chargeable volume together.Compare ocean freight costs across reporting periods.Track average transit days to improve delivery performance.Analyze trade lane volume, route efficiency, and quarterly activity.Compare year-on-year trends and detect changes earlier with WiseAI.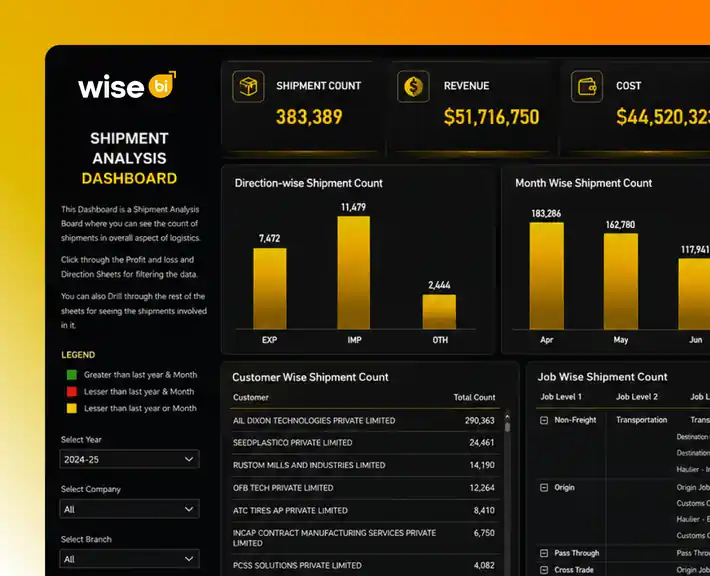
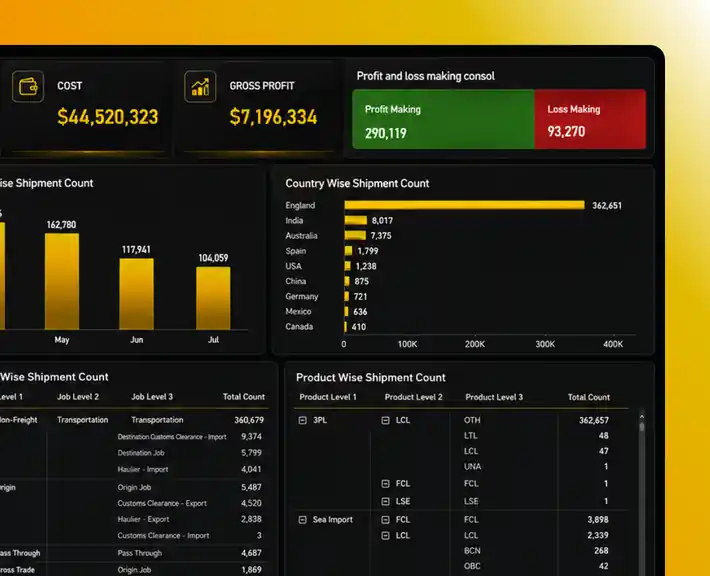
"Every detail is designed to support real-world decision-making."
Synchronize CargoWise shipment, volume, cost, and transit data in real time.Analyze trade lanes with port-wise volume and average transit time.Compare current-year and previous-year operational performance.Filter by company, financial year, quarter, and month.Use WiseAI and clear visuals for faster ocean freight analysis.It measures shipment count, chargeable volume (m³), ocean freight cost, average transit days, trade lane performance, and volume distribution.
Yes. You can compare trade lanes based on volume contribution and average transit days to understand route performance and operational efficiency.
Yes. The dashboard compares current-year and previous-year shipment count, chargeable volume, cost, and average transit days.
Yes. You can analyze ocean freight performance using company, financial year, and quarter filters.
WiseAI answers natural-language questions and highlights unusual changes across trade lanes, shipment activity, transit times, and ocean freight costs.