


Supplier Contribution
Review supplier-wise contribution across total ocean freight volume.

Curated dashboards plus predictive insights that recommend your next move
Tailored BI engineering — bespoke dashboards, data models and integrations built around your logistics stack.
Insights, playbooks and product thinking from the Wise BI team.
200+ logistics & BI terms explained in plain language — from chargeable weight to demurrage.
Deep-dive playbooks on freight analytics, BI adoption and dashboard rollouts — free to download.
See how teams apply Wise BI across quoting, operations, finance and customer success.
Product tours, feature deep-dives and webinar recordings from the Wise BI team.
The team building logistics intelligence for freight-forwarders worldwide.
Questions, demos or partnerships — we reply within one business day.
Duty, compliance and clearance visibility for every customs house.
Duty, compliance and clearance visibility for every customs house.
End-to-end forwarding analytics across air, ocean and road.
Production, inventory and supplier performance on one screen.
Container, slot and vessel analytics for NVOCC operators.
Fleet, route and haulage intelligence for transport teams.
Warehouse throughput, picking and storage insights.
Multi-client billing, SLAs and operations visibility.

See which suppliers drive your ocean chargeable weight, volume contribution, and monthly movement in one connected view.
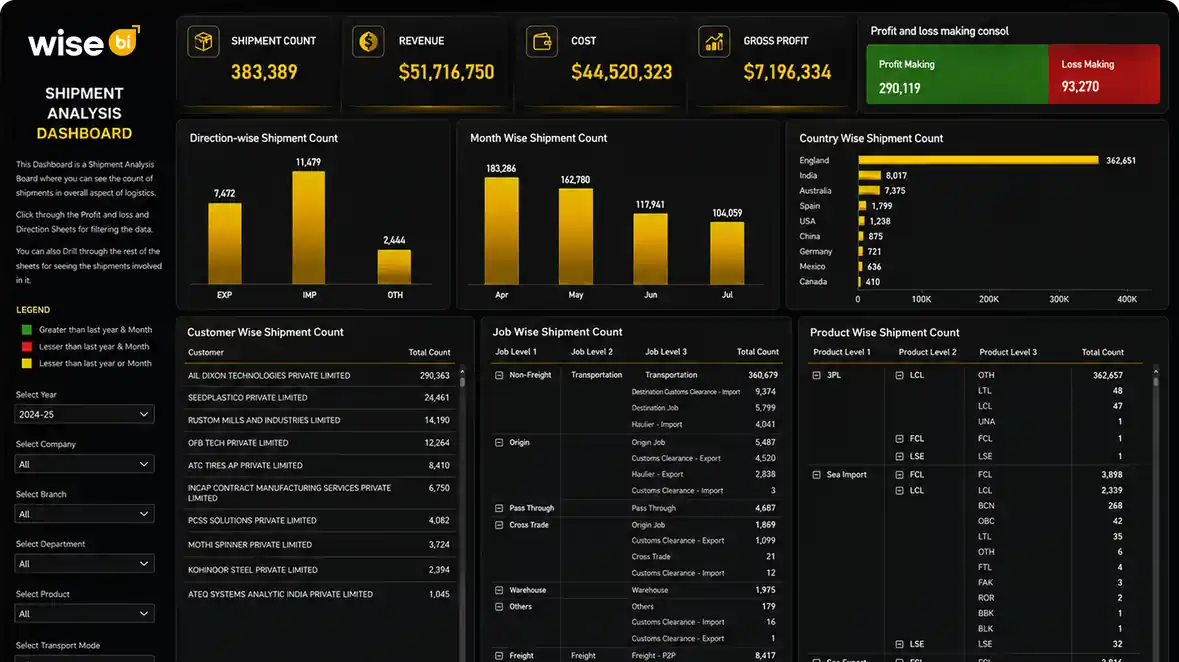

The Problem
Scattered supplier data makes it difficult for teams to rank contributors, compare volume, and act with confidence across operations daily.

Understanding which suppliers contribute the highest freight volume often that requires manual reporting.

Supplier contribution across the total ocean freight volume is difficult to visualize and analyze.

Comparing supplier-wise chargeable volume usually means exporting and consolidating multiple reports.

Without a consolidated supplier view, identifying major volume contributors becomes difficult.
Solution: Clear visibility into supplier volume contribution and ranking.
Capability Overview
The Ocean Total Chargeable Weight by Supplier Dashboard brings supplier contribution, chargeable volume, monthly movement, and supplier rankings into one interactive view, enabling real-time analysis from company-wide totals to individual supplier records.

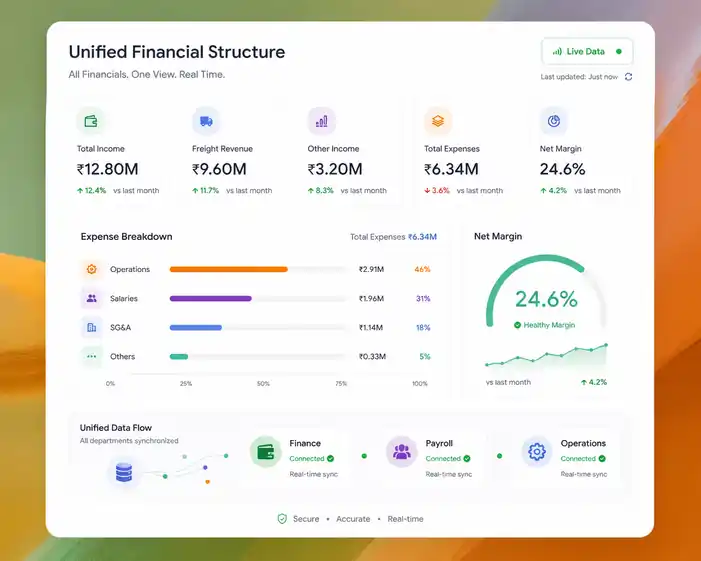
Understand how much chargeable volume each supplier contributes across ocean freight operations.
 Review supplier-wise chargeable volume (m³)Compare supplier contribution percentagesRank suppliers by total volume
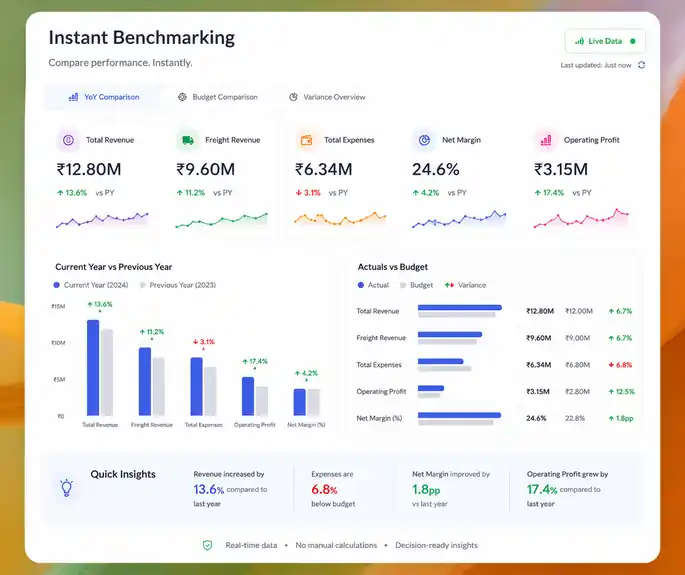
Measure each supplier’s share of total ocean freight volume across the business.
Identify leading suppliersCompare supplier contributionReview overall volume distribution
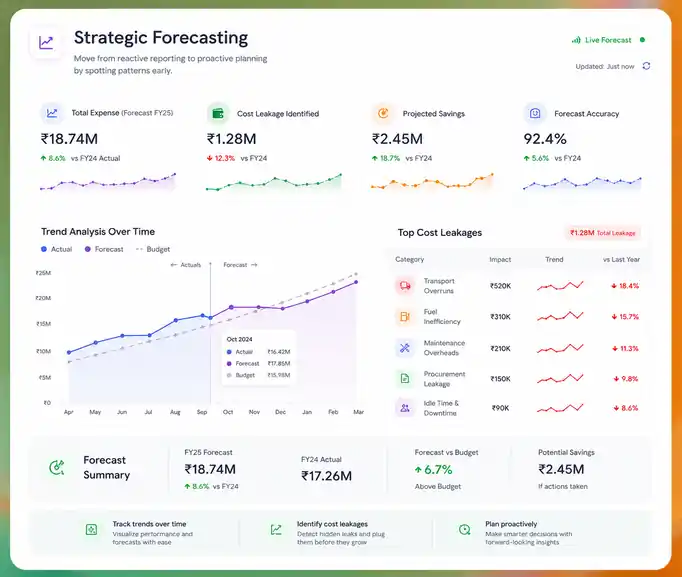
Analyze supplier data through interactive reporting across companies, years, and contribution levels.
Filter by companyFilter by financial yearRefresh supplier analysis instantly
Review complete supplier records from one dashboard with clear operational reporting context.
View supplier namesReview chargeable volumeCompare supplier contribution percentagesMetric Index
Measure supplier contribution and ocean chargeable weight distribution from company totals to supplier records.
Supplier Contribution
Review supplier-wise contribution across total ocean freight volume.
Chargeable Volume
Track supplier chargeable volume in cubic metres.
Contribution Percentage
Measure each supplier’s share of total chargeable volume.
Top Supplier Ranking
Identify suppliers contributing the highest ocean freight volume.
Volume Distribution
Visualize how total chargeable volume is distributed across suppliers.
Company Analysis
Review supplier contribution for the selected company.
Who Benefits from this Dashboard?

Understand supplier contribution across ocean freight operations.

Review supplier volume to support sourcing and supplier engagement.

Analyze supplier volume distribution across the business.

Identify major supplier contributors and understand supplier concentration.
Our dashboard links supplier rankings, chargeable volume, and contribution percentages, helping teams quickly identify top contributors and understand volume distribution. Instead of exporting separate reports, teams review every supplier in one place.
Key Outcomes:
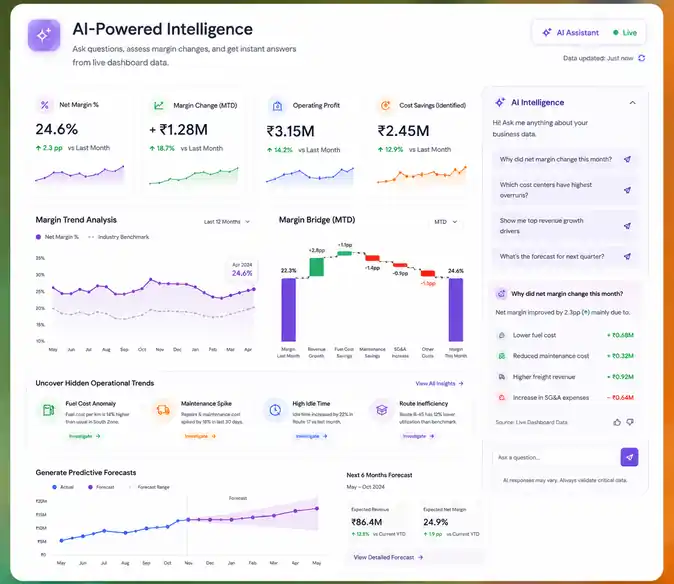
 Identify suppliers contributing the highest freight volume.Compare supplier-wise chargeable volume and contribution percentages.Visualize how volume is distributed across suppliers.Filter supplier analysis by company and financial year.Investigate supplier contribution patterns faster with WiseAI.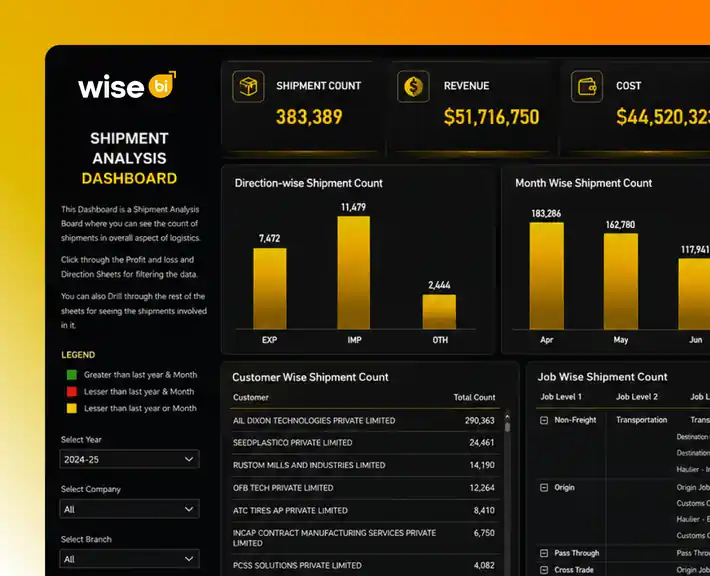
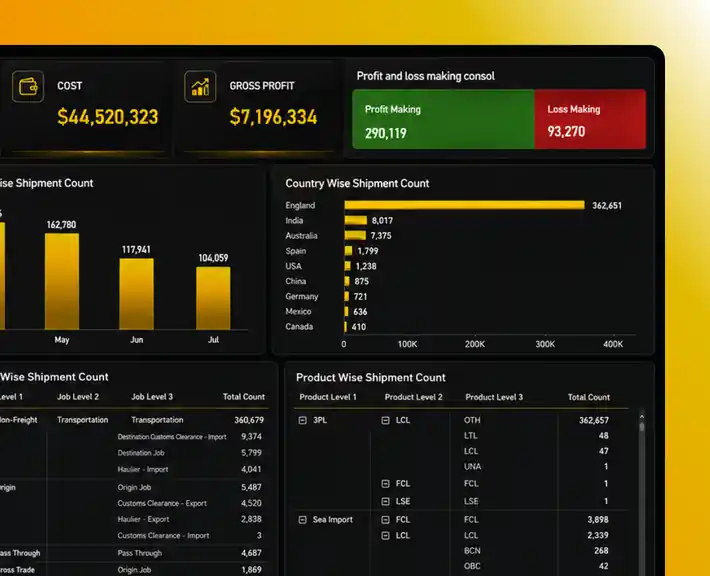
"Every detail is designed to support real-world decision-making."
Synchronize CargoWise supplier and ocean freight data in real time.Rank suppliers by chargeable volume and percentage contribution.Review the full supplier breakdown without switching between reports.Filter by company and financial year for focused analysis.Use WiseAI and clear visuals for faster supplier analysis.It measures supplier-wise chargeable volume, contribution percentage, and supplier rankings across ocean freight operations.
Yes. The dashboard ranks suppliers based on chargeable volume, making it easy to identify your largest volume contributors.
Yes. You can compare each supplier’s percentage contribution to total ocean freight volume from one dashboard.
Yes. The dashboard allows you to filter supplier analysis by company and financial year.
WiseAI helps you investigate supplier contribution, identify volume patterns, and answer operational questions using natural language.