Every day, transportation teams deal with a variety of tasks such as delivery legs, hauler updates, POD statuses, customer follow-ups, delayed movements, and internal reporting.
But here’s the real challenge.
To evaluate overall haulier performance in CargoWise, users must frequently generate multiple reports, manually compare data, and connect the dots between jobs, transportation companies, customers, and delivery timelines.
It requires time. And by the time the complete picture is ready, the problem may have escalated to the point where it requires immediate attention.
CargoWise Hauliers Dashboard
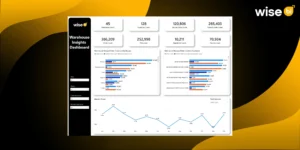
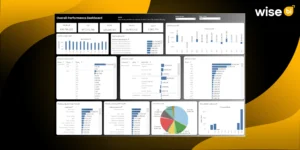
The CargoWise haulier dashboard is an operational business intelligence dashboard that allows logistics teams to monitor transport and delivery performance in a single, centralized view.
Instead of generating multiple CargoWise reports and manually comparing data, the dashboard consolidates key operational metrics into a single view, allowing teams to better understand transport performance and make faster operational decisions.
To put it simply, the CargoWise haulier dashboard enables operations teams to transition from manual transport reporting to real-time operational performance visibility.
📊 Why is this BI Dashboard Important for Transportation Operations?
Delays in road freight are not always obvious from the start. A transport leg may surpass the delivery threshold. A POD update may arrive late. A haulier may repeatedly postpone specific jobs. Before the team has a definitive answer, a customer may begin to request updates.
Without a single performance view, teams frequently spend time:
- 📄 Generating multiple CargoWise reports
- 🧩 Comparing data manually
- 📧 Following up with hauliers for status updates
- 🔁 Checking the same job details repeatedly
- ⚠️ Reacting after delays have already affected operations
The dashboard helps to reduce this effort by consolidating key transport performance data into a single location.
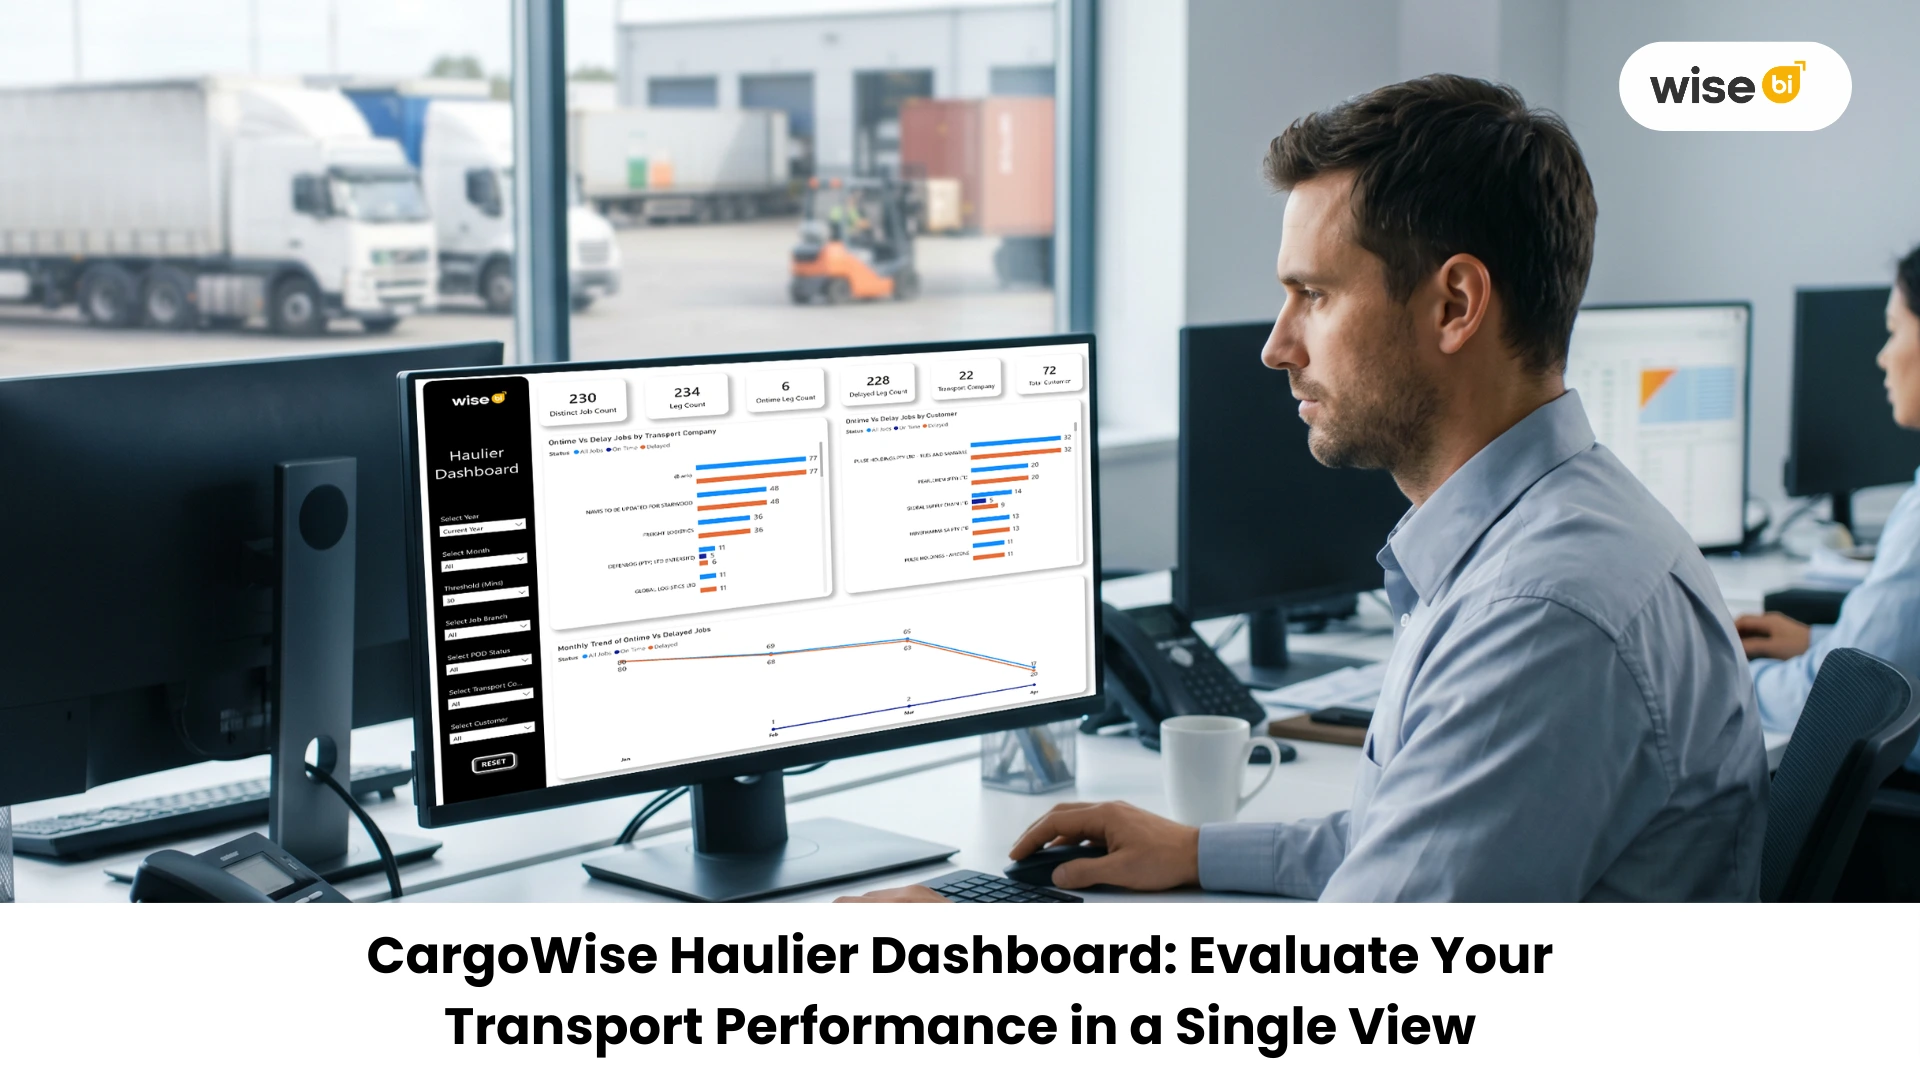
🚛 CargoWise Haulier Dashboard Helps You Track
The BI dashboard is designed to track shipment-based jobs and transportation legs from origin to destination. It enables you to evaluate transportation efficiency and identify delays using predefined threshold timing.
The BI dashboard allows teams to review
- 🚚 Total transport leg activity
- ✅ On-time delivery performance
- ⚠️ Delayed delivery performance
- ⏱️ Average transit days from arrival to completion
- 🚛 Transport company performance
- 👥 Customer-level delay impact
- 🏢 Organisation-type performance
- 📅 Monthly on-time vs delayed trends
This allows your operations and management teams to better understand how transportation performance is changing.
🔍 From Multiple Reports to One Operational View
This is where the business intelligence dashboard really shines.
BI dashboards address reporting gaps in logistics operations. Instead of asking, “Can someone pull the reports?” teams should inquire, “What is the current performance?”
That shift is critical.
A single-view BI dashboard can help teams:
- ⚡ Understand overall transport performance faster
- 📊 Compare haulier performance without manual report work
- 🔍 Identify delayed legs and recurring patterns
- 👥 See which customers are affected by delivery issues
- 🚛 Review transport company performance more clearly
- 📈 Track whether performance is improving or declining over time
It converts CargoWise data from various reports into operational insights.
⚠️ The Real-World Problem it Solves
When transport performance is reviewed manually, delays may appear to be isolated issues.
- One job is overdue.
- One hauler missed an update.
- One POD is pending.
However, when the same problem occurs repeatedly, it forms a pattern, and patterns are difficult to detect when the data is scattered.
The CargoWise haulier dashboard enables teams to identify these patterns earlier.
For example:
- A transport company may have recurring delayed legs
- A specific customer may be affected more often
- Certain organisation types may show bottlenecks
- Monthly trends may reveal performance slipping over time
That kind of insight enables teams to move from reactive follow-up to proactive improvement.
✅ Consider Your Current Analytical Process
- Can your team see overall haulier performance without pulling multiple reports?
- Do you know which transport companies need attention?
- Can you identify delayed legs quickly?
- Are customer-level delay impacts easy to review?
- Can operations and management work from the same performance view?
If these answers are unclear, it’s possible that your issue isn’t due to missing data. The data could be spread across too many reports.
🚀 Final Thoughts
The CargoWise haulier dashboard is designed to help logistics teams understand transport performance without having to manually combine reports.
It provides operations teams with a comprehensive view of delivery timelines, delayed legs, hauler performance, customer impact, and transit efficiency.
Because more reports do not result in better transport decisions. They result from seeing the appropriate performance data in a single, clear view.
Transform CargoWise transportation data into better decisions.
The logistics BI solution can convert CargoWise TMS data into a single, actionable BI dashboard, allowing your team to track delays, improve hauler performance, reduce manual reporting, and make faster operational decisions.