


Your monthly SLA report shows 98% on-time deliveries. But your customer claims 15 orders arrived late. Your operations team says those delays resulted from late order releases, while the customer insists they should count against your performance.
Instead of discussing service improvements, both teams spend the review meeting comparing spreadsheets, checking delivery timestamps, and questioning whose numbers are correct.
This is where manual 3PL SLA reporting creates problems. Different KPI definitions, disconnected data sources, and missing exception records can turn a routine performance review into a lengthy dispute.
A shared, rules-based SLA dashboard gives 3PLs, 4PLs, and their customers a consistent view of service performance. More importantly, it helps everyone focus on identifying problems and improving operations.
Which SLA Metrics should 3PLs and 4PLs Report?
Service Level Agreements (SLAs) define the performance standards logistics providers agree to meet.
For 3PLs, these commitments generally relate to warehouse operations, order fulfillment, and distribution. For 4PLs, reporting may also involve consolidating performance across multiple carriers, warehouses, and logistics partners.
Five metrics are particularly useful for customer SLA reviews.
1. Order Cycle Time
Order cycle time measures how long an order takes to move between agreed processing stages.
For example, a customer may require orders received before 2 PM to be dispatched the same day. Reporting should identify eligible orders that met the commitment and those that missed it.
2. Pick Accuracy
Pick accuracy measures whether warehouse teams select the correct products and quantities.
If 4,950 out of 5,000 eligible order lines are picked correctly, the accuracy rate is 99%.
Tracking errors by product, warehouse location, or shift helps identify recurring fulfillment problems.
3. Dock-to-Stock Time
Dock-to-stock measures the time between an agreed receiving event and inventory becoming available for use.
Long processing times may indicate receiving congestion, inspection delays, or inventory discrepancies.
Reports should distinguish warehouse processing delays from situations where customer documentation or approvals are pending.
4. On-Time Delivery
On-time delivery measures the percentage of eligible deliveries completed within the agreed delivery window.
For 4PLs managing multiple transport providers, this metric helps compare carrier performance across regions and customer accounts.
5. Invoice Accuracy
Invoice accuracy measures whether customer invoices meet agreed billing requirements.
Incorrect rates, duplicate charges, and missing shipment references can create disputes even when warehouse and delivery performance meet expectations.
Why should SLA Definitions be Agreed Before Go-Live?
Two companies can calculate the same KPI differently and produce conflicting results.
Consider on-time delivery. Should performance be measured against the requested delivery date, the confirmed appointment, or the contractual delivery window?
Does the delivery count as completed when the vehicle arrives or when proof of delivery is recorded?
These questions must be answered before operations begin.
For every SLA, logistics providers and customers should agree on:
- KPI definition: What exactly is being measured?
- Measurement events: Which timestamps determine performance?
- Data source: Which WMS, TMS, ERP, or delivery record is authoritative?
- Calculation method: Which transactions count toward the result?
- Performance target: What percentage or time limit must be achieved?
- Exclusion rules: Which documented circumstances qualify for exclusion?
These definitions should be approved before go-live and maintained when operational requirements change.
A rules-based dashboard can then apply the agreed calculations consistently, reducing disagreements during monthly customer reviews.
How should SLA Reports Handle Customer-Caused Delays and Exclusions?
Not every missed service target is the logistics provider’s responsibility.
A customer may release orders after the agreed cutoff. A delivery location may be unavailable during the scheduled appointment. Severe weather or another qualifying force majeure event may interrupt operations.
However, exclusions should follow the contract rather than being applied simply to improve reported performance.
Each excluded event should have a recorded reason, supporting evidence, and an approval status where required.
For example, suppose a provider completes 920 deliveries on time out of 1,000 scheduled deliveries.
The initial on-time performance is 92%.
If 30 late deliveries qualify for contractual exclusion, the adjusted SLA result becomes 920 out of 970 eligible deliveries, or approximately 94.8%.
Both figures matter.
The unadjusted result reflects the customer’s overall delivery experience. The adjusted result measures performance against the agreed contractual rules. Showing both results, along with exclusion reasons, makes SLA reporting more transparent and easier to verify.
How can SLA Dashboards Connect Breaches to Penalties and Root Causes?
A missed SLA target may result in service credits or penalties, depending on the customer agreement.
However, not every missed delivery or picking error automatically creates a financial liability. Contracts may include performance thresholds, approved exclusions, and limits on service credits.
A useful SLA dashboard should connect confirmed performance results with the relevant contractual conditions.
| Reporting Element | What it Shows |
| SLA Target | Agreed performance commitment |
| Actual Performance | Measured result for the reporting period |
| Approved Exclusions | Events excluded under contractual rules |
| Confirmed Breaches | Failures against the agreed target |
| Potential Service Credits | Financial exposure under contract terms |
| Root Causes | Reasons behind recurring service failures |
| Corrective Actions | Actions, owners, and resolution status |
For example, if delivery performance falls below the contractual target, the account manager should be able to investigate which locations, carriers, or operational issues contributed to the result.
Finance teams can then review any applicable credits against the customer agreement before adjustments are approved. This connects SLA reporting with operational accountability and commercial performance.
What should Customers See in a Shared SLA Dashboard?
Customers don’t need every operational metric collected by a logistics provider. They need clear answers about service commitments and exceptions.
A practical dashboard should show contractual targets alongside actual results, previous-period performance, and relevant trends.
It should also allow authorized users to investigate missed targets by warehouse, carrier, customer account, or location.
For example, a 3PL may achieve its overall pick accuracy target while one warehouse continues to report recurring errors. A 4PL may meet its overall delivery commitment even though a particular transport partner consistently performs below expectations.
These differences are difficult to explain through a single monthly percentage.
A shared dashboard helps customers understand where problems occurred, why they happened, and which corrective actions are underway.
How can WiseBI Support 3PL and 4PL SLA Reporting?
WiseBI provides business intelligence capabilities for analyzing logistics performance using connected operational data.
For SLA reporting, several dashboard approaches can support different reporting needs.
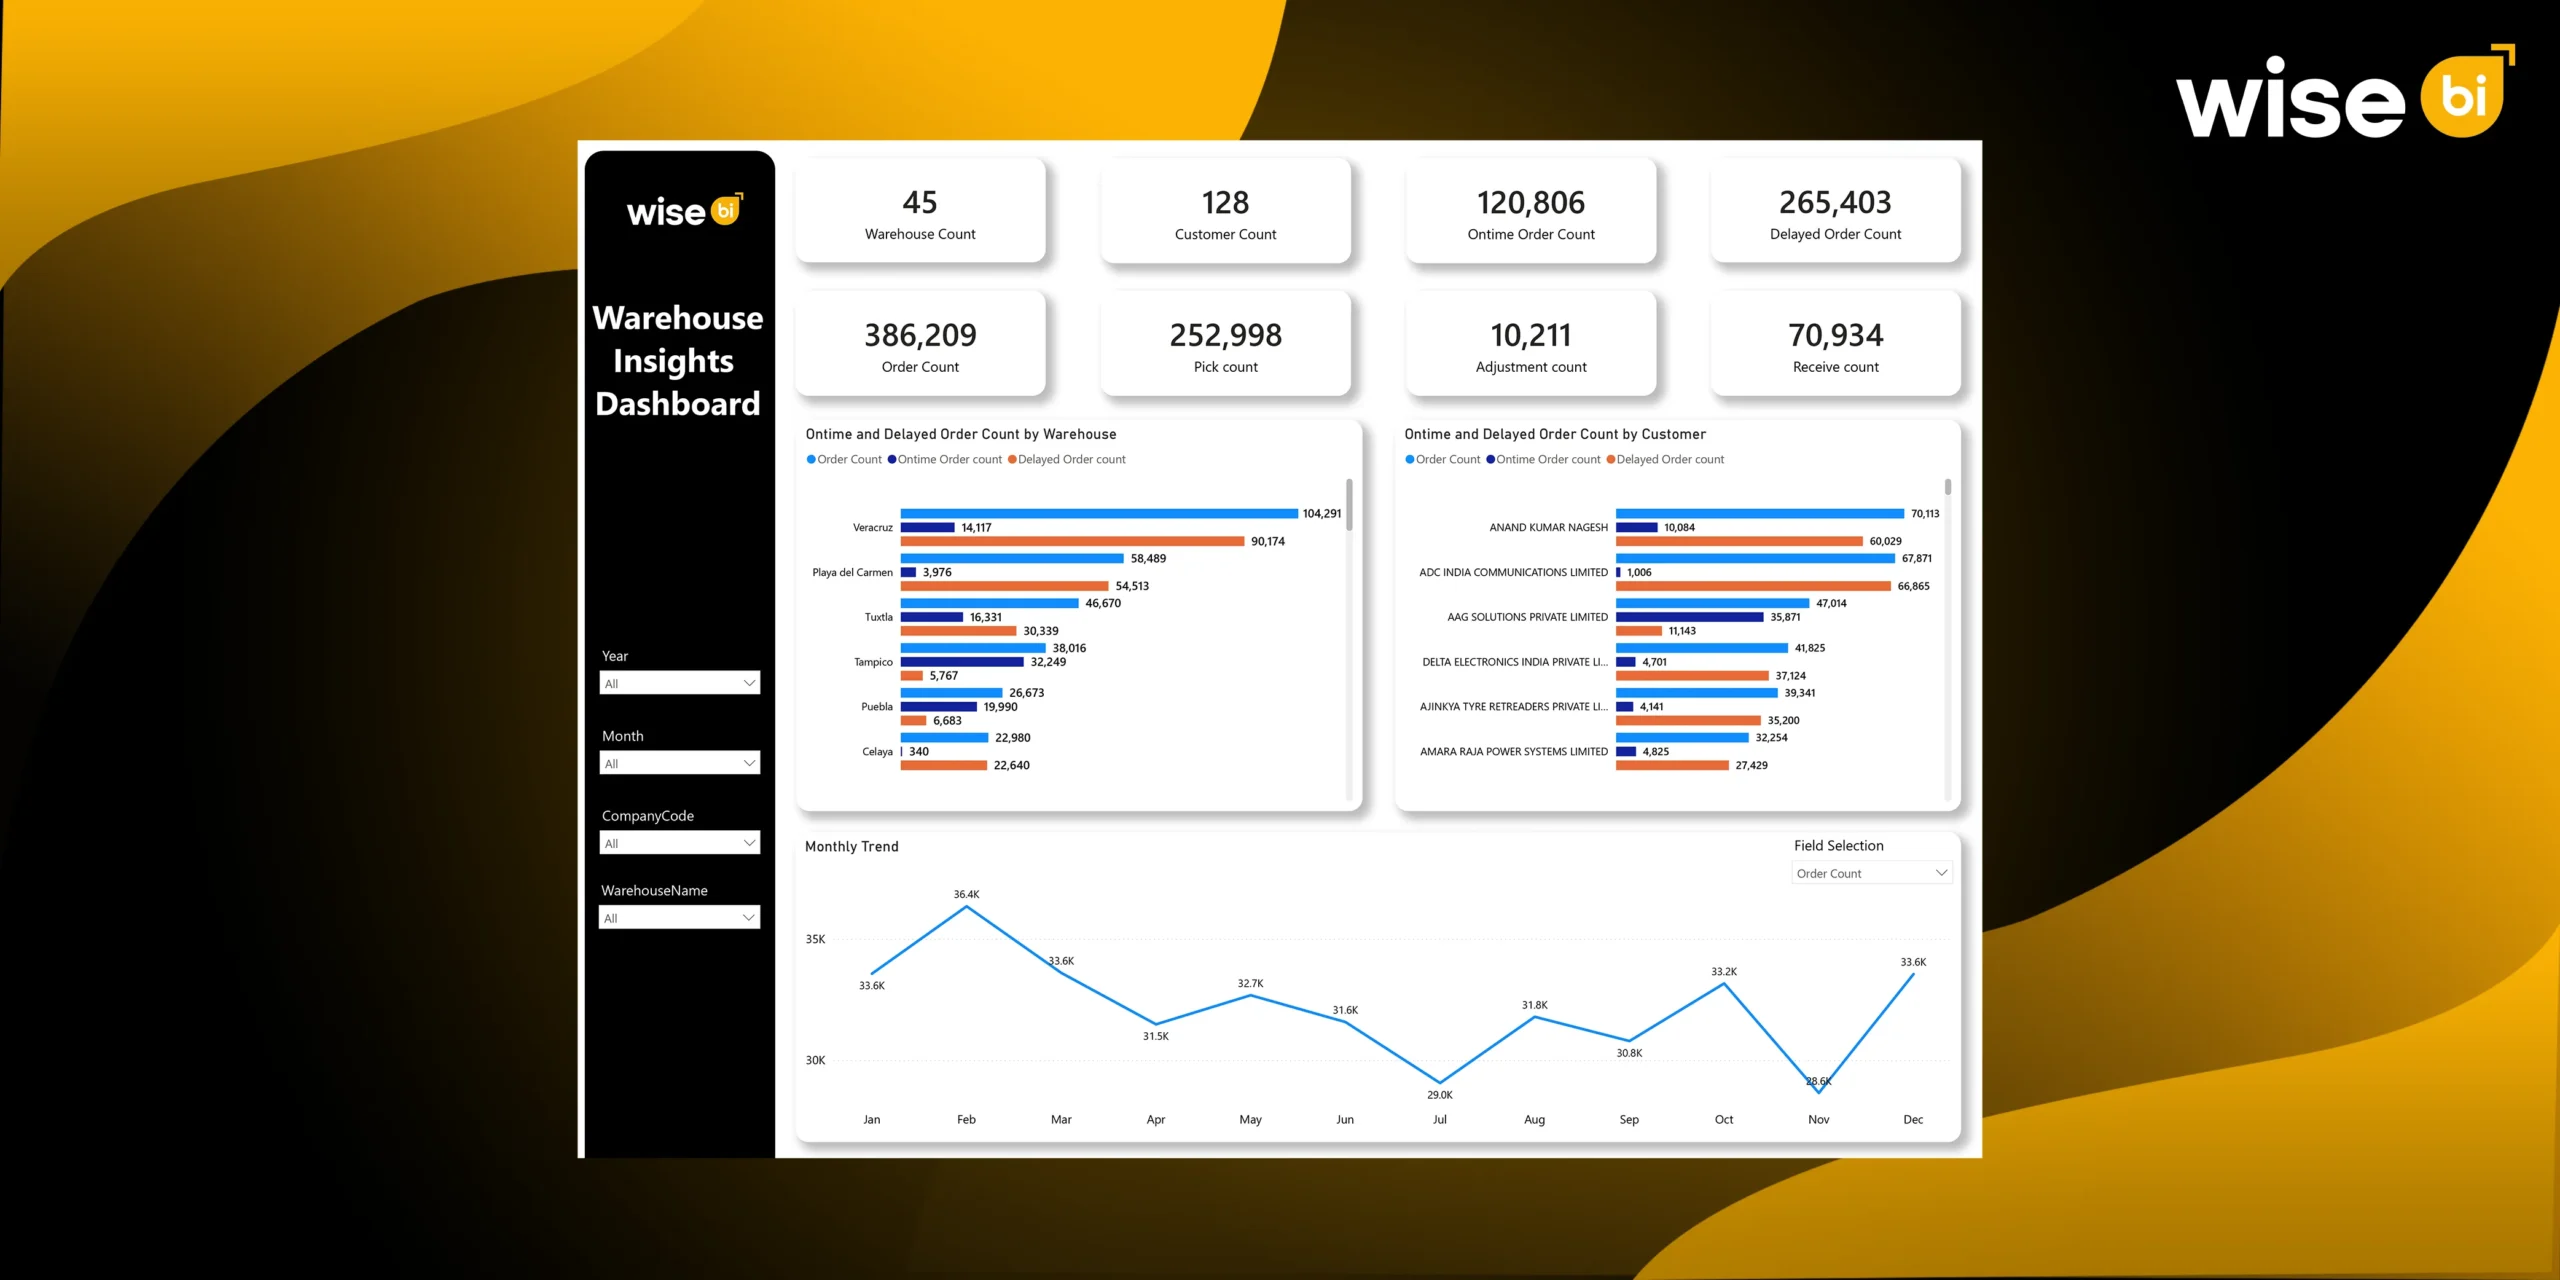
Warehouse Dashboards: Warehouse-focused reporting can help analyze receiving, picking, inventory, and order-processing performance when the necessary operational data is available.
KPI and Performance Dashboards: Configured dashboards can compare agreed service targets against actual results, helping account managers monitor trends and identify exceptions.
Control Tower Reporting: A consolidated control tower view can combine relevant warehouse, transport, and logistics partner information to support performance reviews across multiple operations.
These capabilities depend on available integrations, data quality, and configured SLA rules. Customer-specific exclusions, penalties, and service credits may require additional reporting measures.
With consistent data and calculations, logistics providers can reduce manual spreadsheet preparation and give customers a more reliable basis for performance discussions. Instead of spending meetings reconciling different reports, teams can focus on resolving service issues and monitoring corrective actions.
Conclusion
Effective 3PL SLA reporting goes beyond presenting monthly performance percentages.
Customers need to understand whether service commitments were met, which exceptions affected the results, and what the logistics provider is doing to improve performance.
For 3PLs and 4PLs, this starts with agreed KPI definitions, reliable data sources, transparent exclusion rules, and clear accountability for service failures.
A shared, rules-based dashboard helps turn SLA reviews from discussions about conflicting numbers into conversations about measurable improvements.
Want to make your logistics performance reporting more consistent and useful for customer reviews?
Book a free demo with WiseBI to explore how configurable dashboards can support your logistics performance reporting needs.